

Bitcoin declined towards the $18,500 support zone against the US Dollar. BTC recovered sharply, but the bears are still active near the $20,500 and $20,650 levels.
- Bitcoin climbed higher sharply after there was a test of the $18,500 zone.
- The price is now trading above the $20,000 level and near the 100 hourly simple moving average.
- There is a major bearish trend line forming with resistance near $20,400 on the hourly chart of the BTC/USD pair (data feed from Kraken).
- The pair could start a fresh decline unless there is a move above the $20,500 resistance zone.
Bitcoin Price Eyes Upside Break
Bitcoin price started another decline below the $20,000 support zone. The price even traded below the $19,200 support zone and spiked below the $18,800 level.
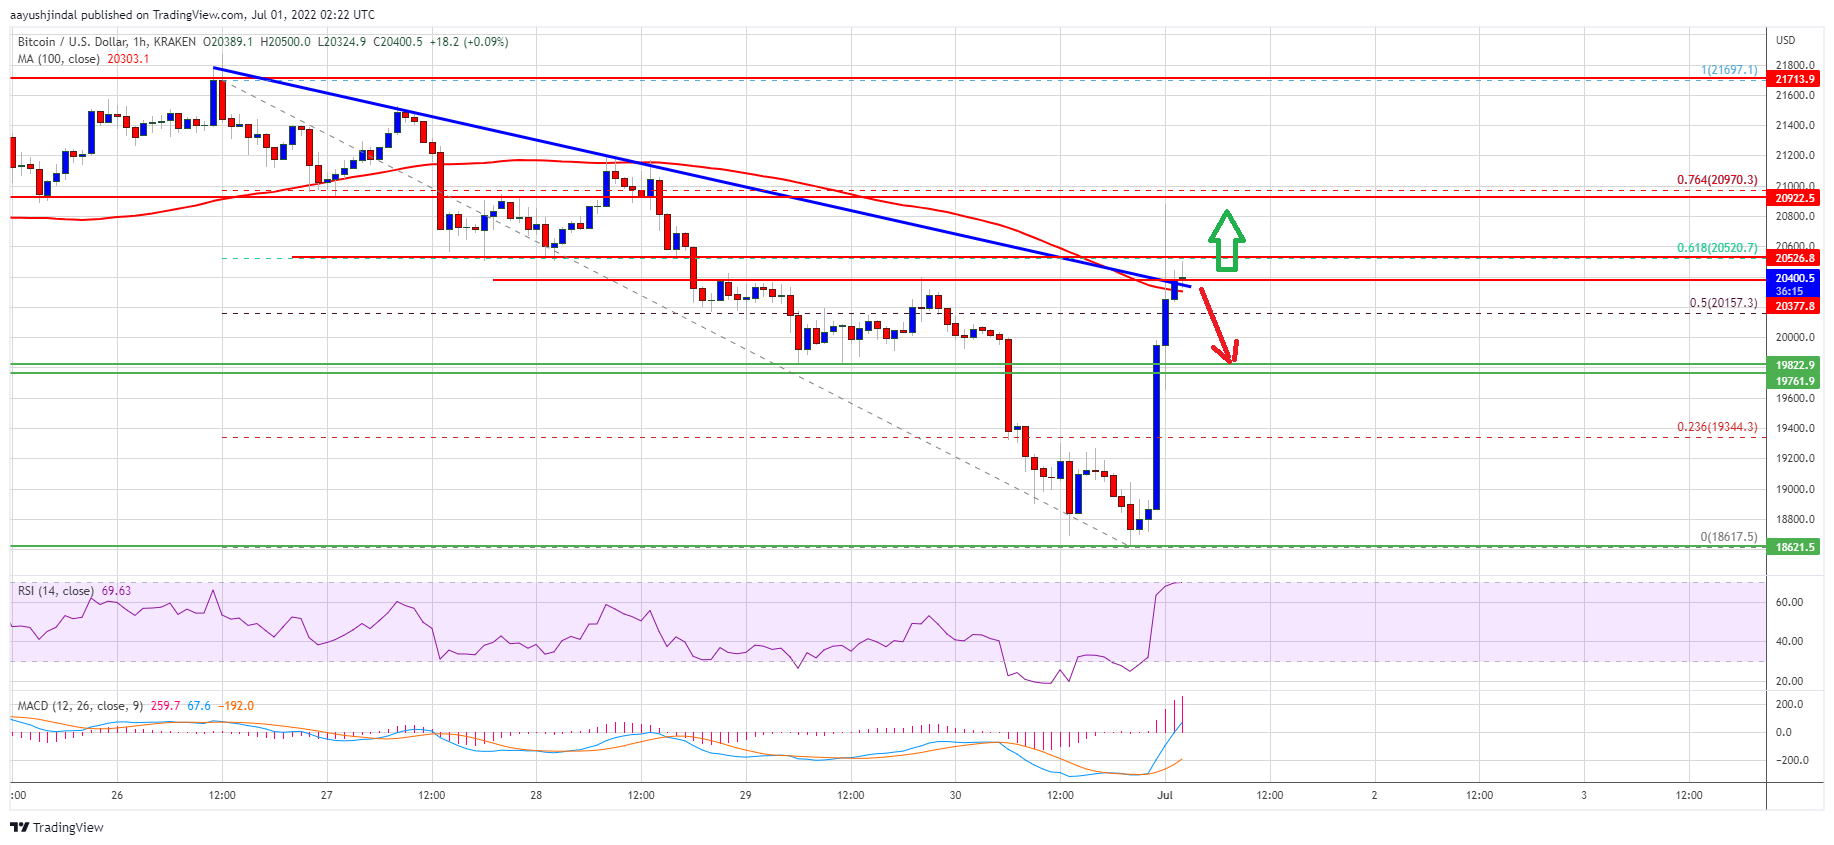
There was a test of the $18,600 zone and the price traded as low as $18,617. Recently, there was a sharp upward move and the price climbed above the $19,500 resistance. There was a move above the 50% Fib retracement level of the key drop from the $21,697 swing high to $18,617 low.
However, the price is now facing a strong resistance near the $20,500 zone and the 100 hourly simple moving average. There is also a major bearish trend line forming with resistance near $20,400 on the hourly chart of the BTC/USD pair.
The trend line is close to the 61.8% Fib retracement level of the key drop from the $21,697 swing high to $18,617 low. An immediate resistance on the upside is near the $20,500 level.
Source: BTCUSD on TradingView.com
The next key resistance is near the $20,950 zone. A clear move above the trend line resistance and then $20,950 could push the price further higher. In the stated case, the price could rise towards the $21,650 level. The next major resistance sits near the $22,500 level.
Fresh Decline in BTC?
If bitcoin fails to clear the $20,500 resistance zone, it could start another decline. An immediate support on the downside is near the $20,000 level.
The next major support now sits near the $19,800 level, below which the price could decline heavily. In the stated case, the price may perhaps decline towards the $18,500 level.
Technical indicators:
Hourly MACD – The MACD is now gaining pace in the bullish zone.
Hourly RSI (Relative Strength Index) – The RSI for BTC/USD is now above the 50 level.
Major Support Levels – $20,000, followed by $19,800.
Major Resistance Levels – $20,500, $20,950 and $21,650.