

Bitcoin struggled above the $21,500 resistance zone against the US Dollar. BTC is trimming gains and might find support near the 100 hourly SMA.
- Bitcoin climbed above the $21,500 level before it faced sellers.
- The price is now above the $20,000 level and the 100 hourly simple moving average.
- There was a break below a key bullish trend line with support near $21,175 on the hourly chart of the BTC/USD pair (data feed from Kraken).
- The pair could find bids near the $20,000 zone or the 100 hourly simple moving average.
Bitcoin Price Dips
Bitcoin price started an upside correction above the $20,000 resistance zone. There was a decent recovery wave above the $20,200 and $20,500 levels.
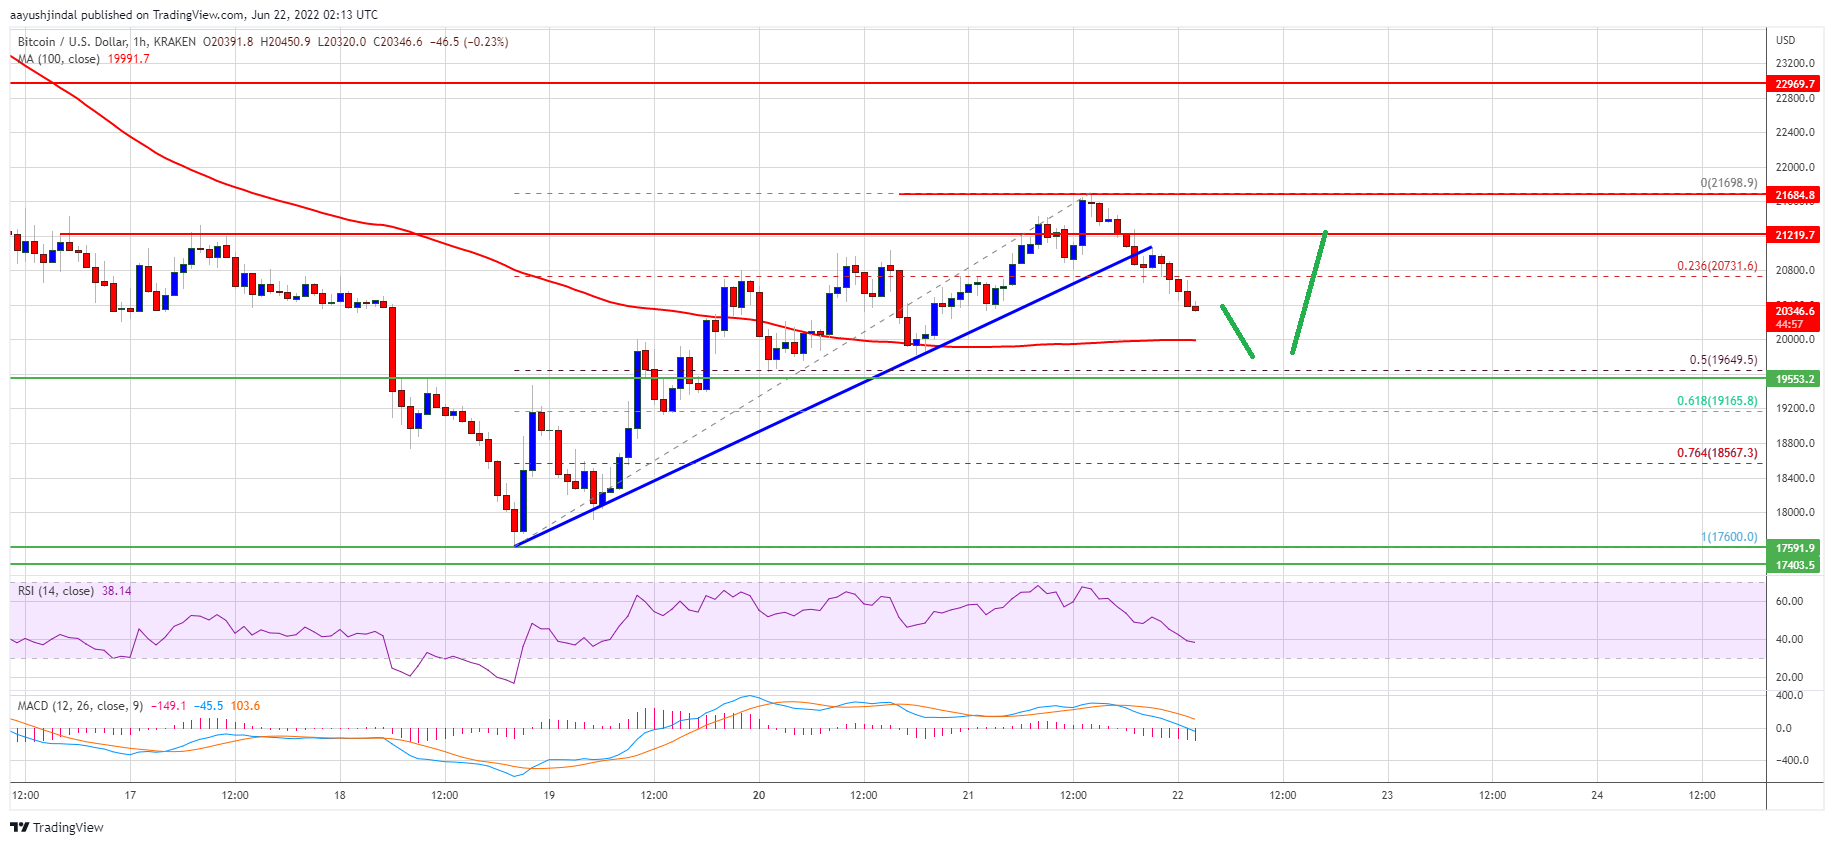
The price climbed the 61.8% Fib retracement level of the key downside from the $22,950 high to $17,600 low. Finally, there was a move above the $21,000 resistance zone and the price settled above the 100 hourly simple moving average.
However, the bears were active above the $21,500 level. A high was formed near the $21,698 and the price started a downside correction.
There was a break below the 23.6% Fib retracement level of the upward move from the $17,600 swing low to $21,698 high. Besides, there was a break below a key bullish trend line with support near $21,175 on the hourly chart of the BTC/USD pair.
The price is now trading below $21,000. An immediate resistance on the upside is near the $20,550 level. The first major resistance is near the $21,000 and $21,220 levels.
Source: BTCUSD on TradingView.com
A clear move above the $21,220 level might call for a move to $21,700. Any more gains might send the price towards the $22,200 level in the coming sessions.
More Losses in BTC?
If bitcoin fails to clear the $21,220 resistance zone, it could continue to move down. An immediate support on the downside is near the $20,000 level and the 100 hourly SMA.
The next major support is near the $19,650 level. It is near the 50% Fib retracement level of the upward move from the $17,600 swing low to $21,698 high. A downside break below the $19,650 support could restart downtrend in the near term.
Technical indicators:
Hourly MACD – The MACD is now gaining pace in the bearish zone.
Hourly RSI (Relative Strength Index) – The RSI for BTC/USD is now below the 50 level.
Major Support Levels – $20,000, followed by $19,650.
Major Resistance Levels – $20,500, $21,220 and $21,700.