

Ethereum failed to clear the $1,250 resistance against the US Dollar. ETH is declining and remains at a risk of more downsides below the $1,000 support.
- Ethereum started a fresh decline after it failed to surpass the $1,250 zone.
- The price is now trading below $1,200 and the 100 hourly simple moving average.
- There is a connecting bearish trend line forming with resistance near $1,095 on the hourly chart of ETH/USD (data feed via Kraken).
- The pair could resume its decline unless it clears $1,150 and $1,200 in the near term.
Ethereum Price Remains At Risk
Ethereum attempted a recovery wave above the $1,200 resistance zone. However, the bears were active near the $1,250 level. A high was formed near $1,256 and the price started a fresh decline.
There was a move below the $1,200 and $1,150 levels. The price even settled below the $1,200 level and the 100 hourly simple moving average. A low was formed near $1,050 and ether is now consolidating losses. An immediate resistance is near the $1,090 level.
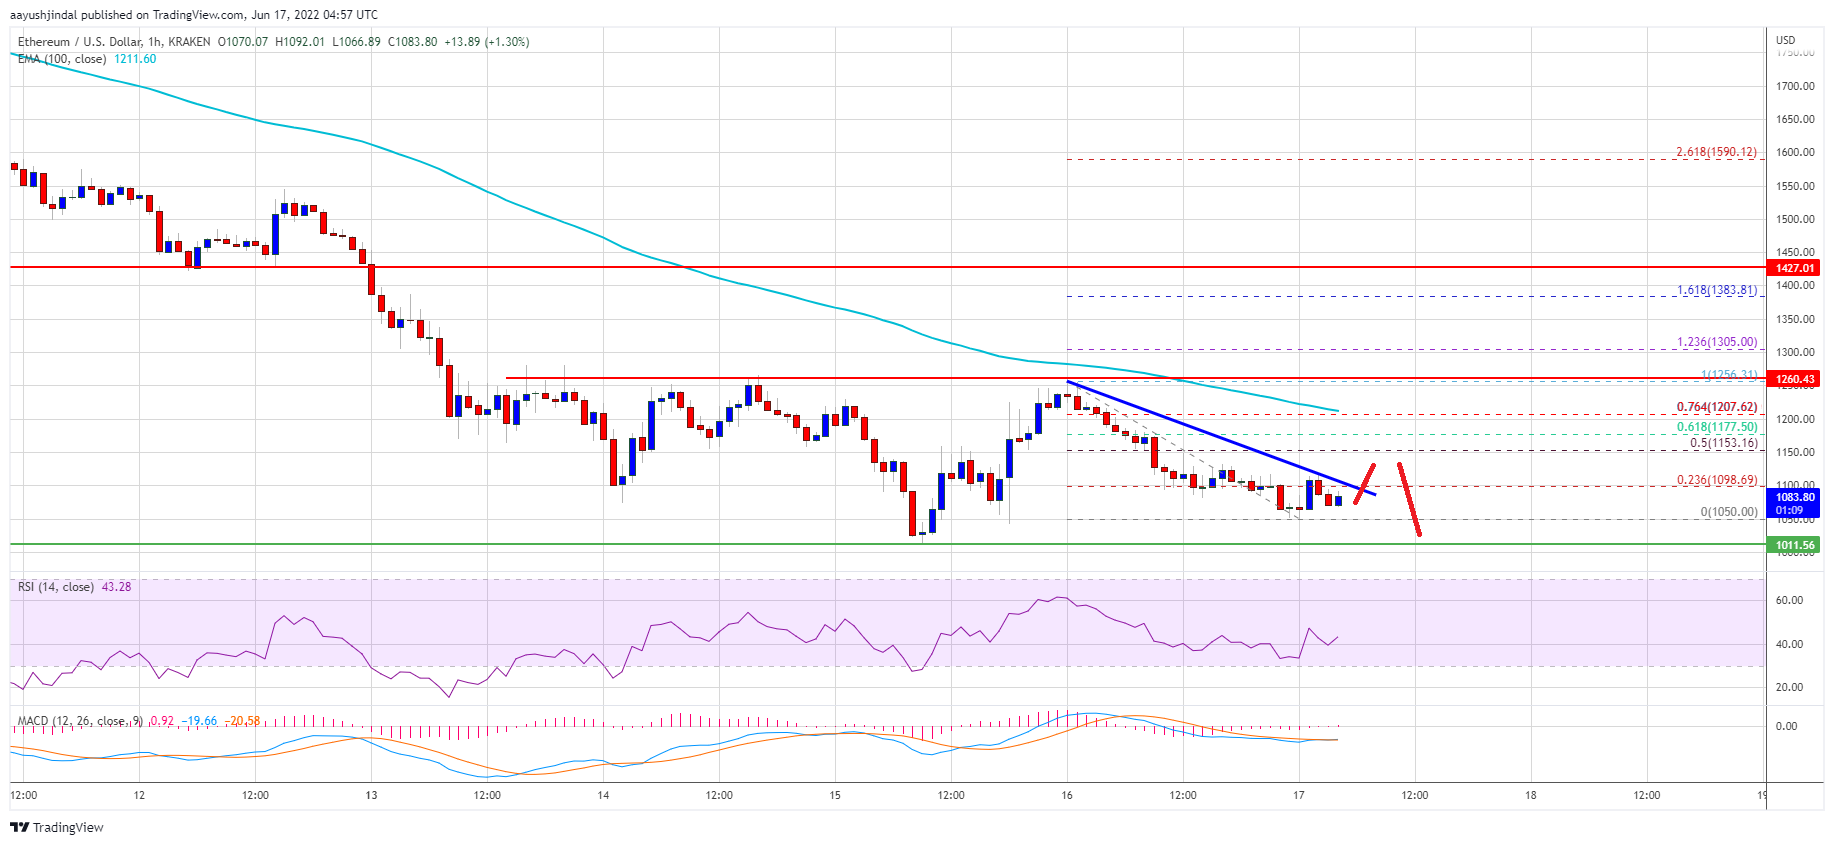
There is also a connecting bearish trend line forming with resistance near $1,095 on the hourly chart of ETH/USD. The trend line is near the 23.6% Fib retracement level of the recent drop from the $1,256 swing high to $1,050 low.
The next major resistance is near the $1,150 zone. It is close to the 50% Fib retracement level of the recent drop from the $1,256 swing high to $1,050 low. Any more gains might call for a test of the $1,200 level or the 100 hourly simple moving average.
Source: ETHUSD on TradingView.com
A clear move above the $1,200 resistance zone may perhaps start a decent upward move. The next major resistance is near the $1,260 level. Any more gains could start a move towards the $1,350 resistance.
More Losses in ETH?
If ethereum fails to rise above the $1,200 resistance, it could continue to move down. An initial support on the downside is near the $1,050 zone.
The next major support is near the $1,000 zone. A clear move and break below the $1,000 zone could start a major decline. In the stated case, the price could slide towards the $880 support zone in the near term.
Technical Indicators
Hourly MACD – The MACD for ETH/USD is now losing momentum in the bearish zone.
Hourly RSI – The RSI for ETH/USD is now below the 50 level.
Major Support Level – $1,000
Major Resistance Level – $1,200