

Bitcoin formed a base near the $21,000 level against the US Dollar. BTC is attempting a recovery wave, but the bears might protect gains above $23,000.
- Bitcoin traded as low as $20,824 before the bulls took a stand.
- The price is now trading below the $24,000 level and the 100 hourly simple moving average.
- There is a key bearish trend line forming with resistance near $22,050 on the hourly chart of the BTC/USD pair (data feed from Kraken).
- The pair must clear the $23,000 resistance zone to start a decent recovery wave.
Bitcoin Price Remains In Downtrend
Bitcoin price remained in a bearish zone below the $25,000 support zone. The price spiked below the $21,000 level and settled well below the $23,000 level.
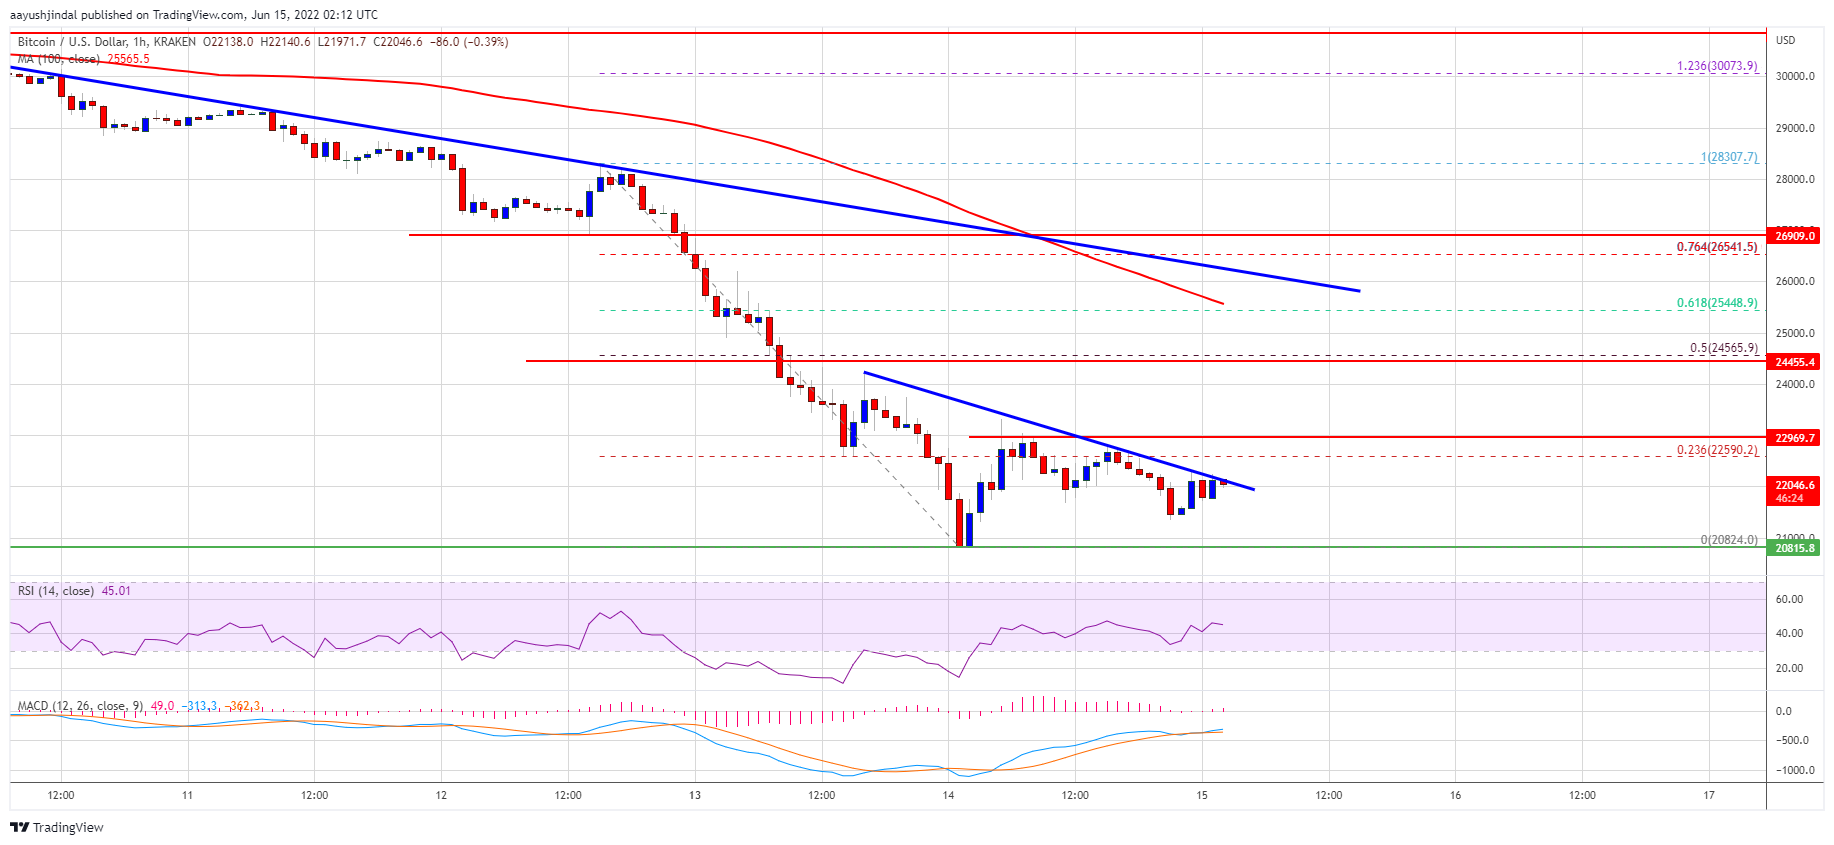
A low was formed near $20,824 and the price is now attempting an upside correction. There was a move above the $22,000 resistance level. However, the price is still well below the $24,000 level and the 100 hourly simple moving average.
An immediate resistance on the upside is near the $21,100 level. There is also a key bearish trend line forming with resistance near $22,050 on the hourly chart of the BTC/USD pair.
The first major resistance is near the $22,600 level. It is near the 23.6% Fib retracement level of the downward move from $28,300 swing high to $20,825 low. If there is a clear move above the trend line, the pair could rise towards the $23,000 resistance.
Source: BTCUSD on TradingView.com
The main resistance is near the $24,600 level. It is near the 50% Fib retracement level of the downward move from $28,300 swing high to $20,825 low. A clear move above the $24,500 and $25,000 levels could set the pace for a strong upward move.
Fresh Decline in BTC?
If bitcoin fails to clear the $22,600 resistance zone and the trend line, it could start a fresh decline. An immediate support on the downside is near the $21,250 level.
The next major support is near the $21,000 level. A downside break below the $21,000 support could send the price towards the $20,825 swing low. Any more losses may perhaps call for a test of $20,000.
Technical indicators:
Hourly MACD – The MACD is now losing pace in the bearish zone.
Hourly RSI (Relative Strength Index) – The RSI for BTC/USD is still below the 50 level.
Major Support Levels – $21,250, followed by $21,000.
Major Resistance Levels – $22,100, $22,600 and $23,000.