

Bitcoin extended its decline below the $25,000 support against the US Dollar. BTC is down 20% and approaching the key $20,000 support zone.
- Bitcoin extended its decline below the $23,500 and $22,500 support levels.
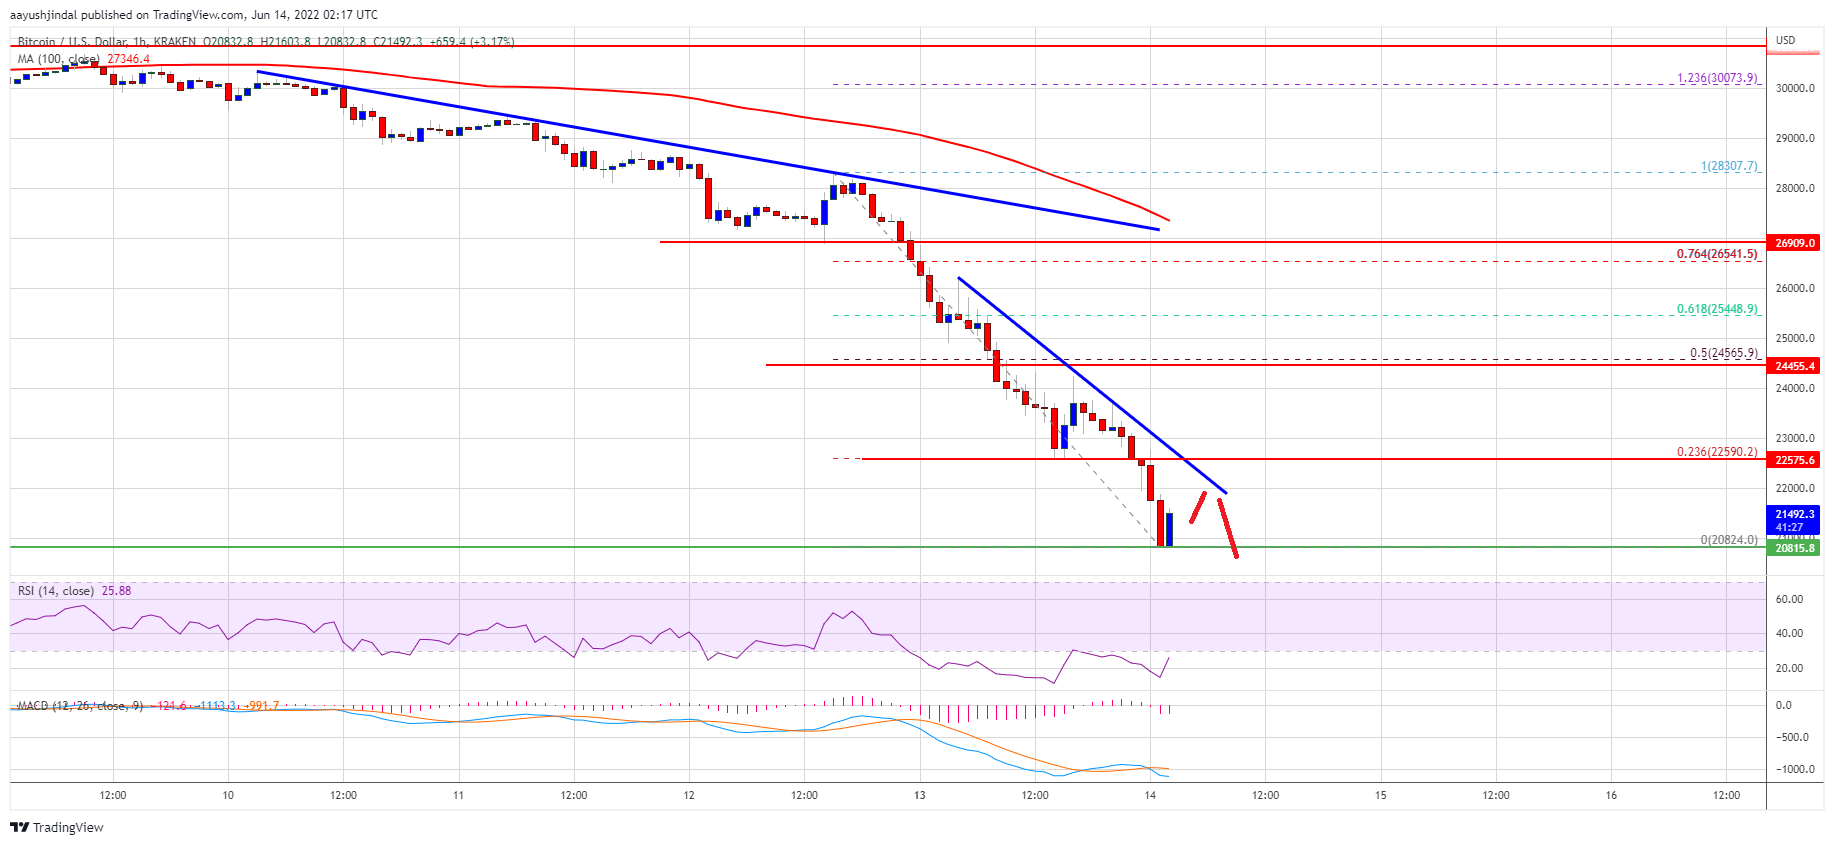
- The price is now trading below the $25,000 level and the 100 hourly simple moving average.
- There is a connecting bearish trend line forming with resistance near $22,100 on the hourly chart of the BTC/USD pair (data feed from Kraken).
- The pair must stay above the key $20,000 support zone to avoid more downsides.
Bitcoin Price Nosedives
Bitcoin price failed to start a recovery wave and extended decline below the $25,000 support zone. The bears gained strength for a move below the $23,500 support zone.
The price declined over 20% and even traded below the $22,000 support zone. A new multi-week low is formed near $20,824 and the price is still trading in a strong downtrend. There was a close below the $22,000 level and the 100 hourly simple moving average.
Bitcoin is now consolidating near the $21,000 level. An immediate resistance on the upside is near the $21,800 level. The first major resistance is near the $22,000 level.
There is also a connecting bearish trend line forming with resistance near $22,100 on the hourly chart of the BTC/USD pair. It is near the 23.6% Fib retracement level of the recent drop from the $28,300 swing high to $20,824 low.
Source: BTCUSD on TradingView.com
If there is a clear move above the trend line, the pair could rise towards the $23,000 level. The main resistance is near the $25,000 level. It is near the 50% Fib retracement level of the recent drop from the $28,300 swing high to $20,824 low.
More Losses in BTC?
If bitcoin fails to clear the $22,100 resistance zone and the trend line, it could continue to move down. An immediate support on the downside is near the $21,000 level.
The next major support is near the $20,000 level. A downside break below the $20,000 support could send the price further lower. In the stated case, the price could drop towards the $18,500 support zone in the near term.
Technical indicators:
Hourly MACD – The MACD is now gaining pace in the bearish zone.
Hourly RSI (Relative Strength Index) – The RSI for BTC/USD is now in the oversold area.
Major Support Levels – $21,000, followed by $20,000.
Major Resistance Levels – $22,000, $22,100 and $23,000.