

Bitcoin is holding the key $29,500 support against the US Dollar. BTC must clear the $31,500 resistance zone to start a major increase in the near term.
- Bitcoin is showing a few positive signs above the $29,500 support zone.
- The price is now trading below the $30,500 level and the 100 hourly simple moving average.
- There is a major contracting triangle forming with resistance near $31,250 on the hourly chart of the BTC/USD pair (data feed from Kraken).
- The pair could start a strong increase if there is a clear move above the $31,500 resistance.
Bitcoin Price Remains In A Range
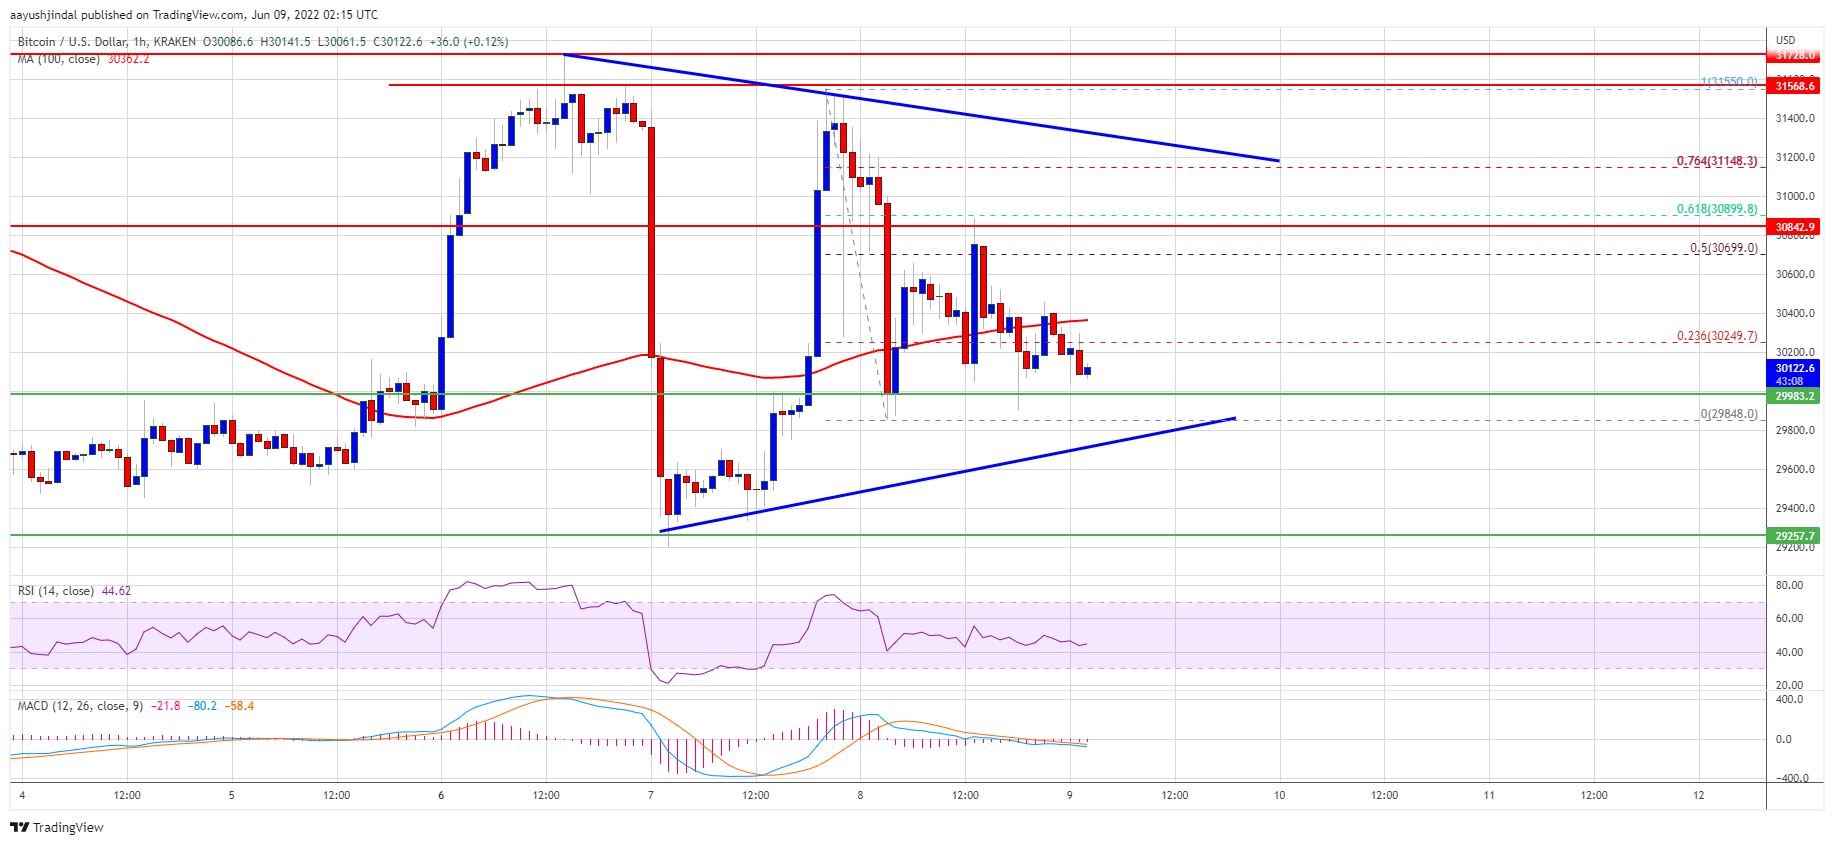
Bitcoin price attempted a fresh increase above the $31,200 and $31,500 resistance levels. However, the bears were active near the $31,500 zone. A high was formed near $31,550 and the price corrected gains.
There was a move below the $31,000 and $30,500 support levels. A low was formed near $29,848 and the price is now consolidating in a range. There was a recovery above the $30,000 resistance zone. The price spiked above the 23.6% Fib retracement level of the recent decline from the $31,550 high to $29,848 low.
However, the price struggled near the $30,700 level. Bitcoin is now trading below the $30,500 level and the 100 hourly simple moving average.
An immediate resistance on the upside is near the $30,400 level and the 100 hourly simple moving average. The first major resistance is near the $30,850 level. The main resistance is near the $31,250 level. There is also a major contracting triangle forming with resistance near $31,250 on the hourly chart of the BTC/USD pair.
Source: BTCUSD on TradingView.com
A clear move above the $31,250 resistance level could send the price further higher. The next major resistance might be $32,000. Any more gains might call for a trend change and a move towards the $33,200 level.
Downside Break in BTC?
If bitcoin fails to clear the $31,250 resistance zone, it could start another decline. An immediate support on the downside is near the $30,000 level.
The next major support is near the $29,850 level. The main support is still near the $29,500 zone. A downside break below the $29,500 support may perhaps spark another decline. In the stated case, the price could dive towards the $28,500 support zone in the near term.
Technical indicators:
Hourly MACD – The MACD is now losing pace in the bearish zone.
Hourly RSI (Relative Strength Index) – The RSI for BTC/USD is now just below the 50 level.
Major Support Levels – $30,000, followed by $29,500.
Major Resistance Levels – $30,400, $30,850 and $31,250.