

Ethereum struggled to clear the key $1,920 resistance against the US Dollar. ETH declined sharply and now testing the main $1,700 support zone.
- Ethereum failed to surpass the main $1,920 resistance zone.
- The price is now trading below $1,800 and the 100 hourly simple moving average.
- There was a break below a major bullish trend line with support near $1,800 on the hourly chart of ETH/USD (data feed via Kraken).
- The pair might decline heavily if there is a clear move below the $1,700 support zone.
Ethereum Price Trims Gains
Ethereum gained pace above the $1,850 resistance level to start a recovery wave. There was a steady move above the $1,880 level and the 100 hourly simple moving average.
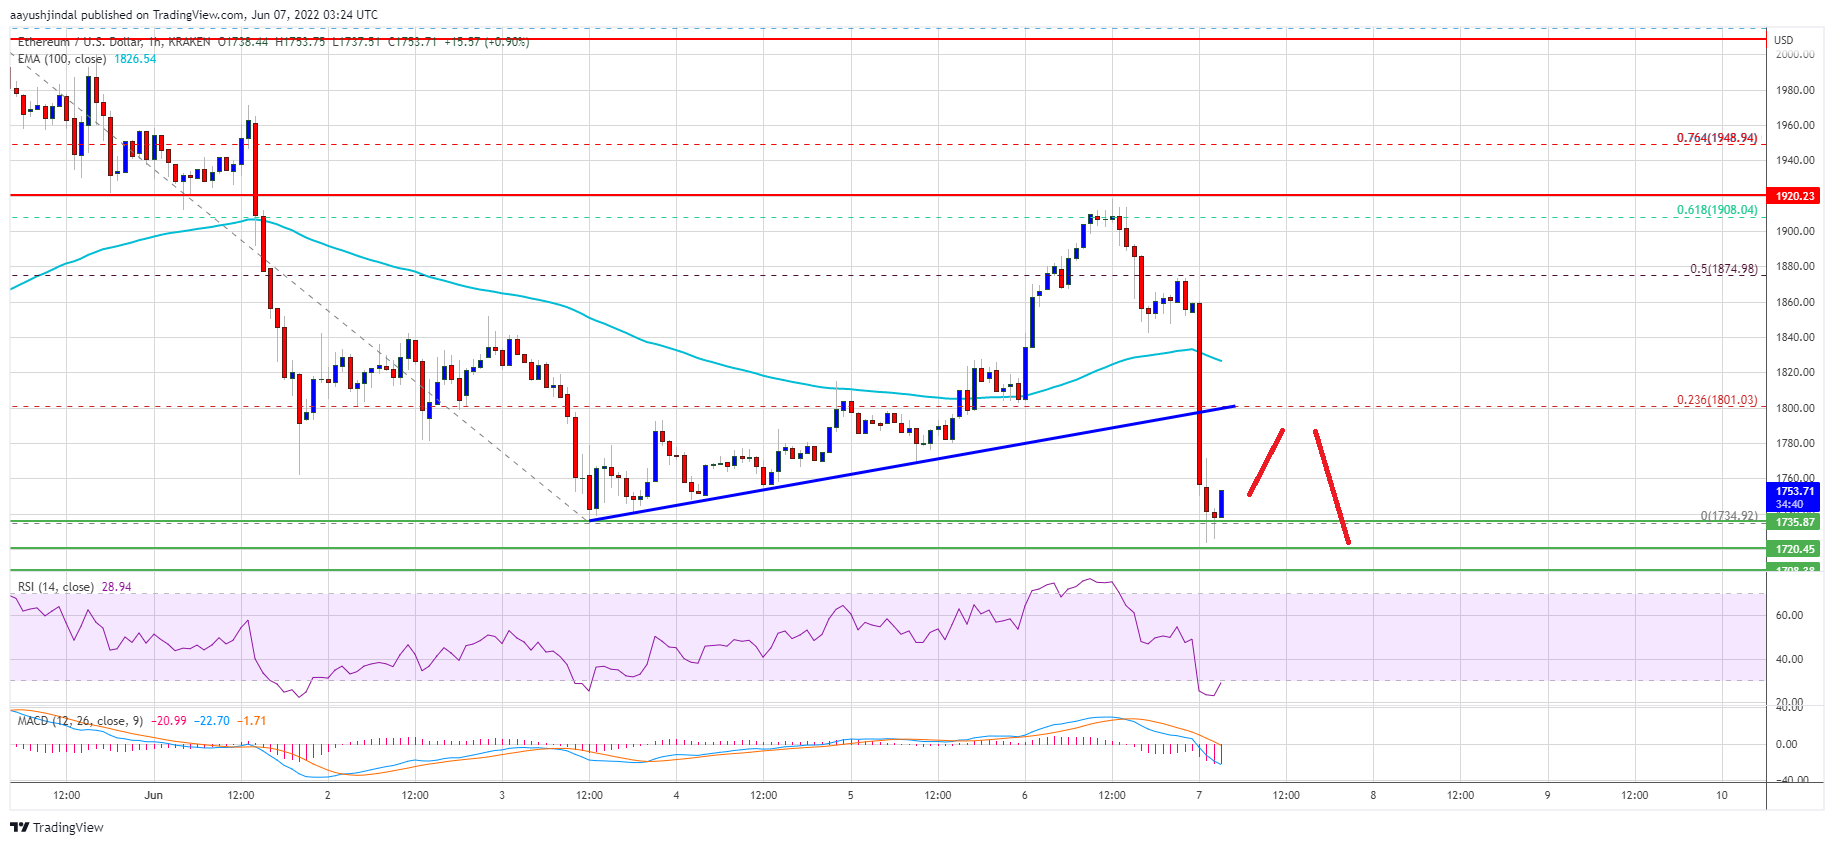
The price climbed above the 50% Fib retracement level of the key decline from the $2,015 swing high to $1,735 low. Ether price even moved above the $1,900 level, but the bears remained active near the main hurdle at $1,920.
The price struggled above the $1,900 level. It faced sellers near the 61.8% Fib retracement level of the key decline from the $2,015 swing high to $1,735 low.
As a result, there was a sharp decline below the $1,850 support. There was a break below a major bullish trend line with support near $1,800 on the hourly chart of ETH/USD. Ether price declined heavily and even broke the $1,750 support zone.
Source: ETHUSD on TradingView.com
It is now consolidating losses above the $1,700 support. On the upside, an initial resistance is near the $1,780 level. The next major resistance is near the $1,800 and $1,820 levels. A clear move above the $1,820 resistance might start a decent recovery. In the stated case, the price could revisit $1,850. Any more gains might set the pace for a move towards $1,900.
More Losses in ETH?
If ethereum fails to rise above the $1,820 resistance, it could continue to move down. An initial support on the downside is near the $1,720 zone.
The next major support is near the $1,700 level. A clear move below the $1,700 level might spark a major decline. The next major support might be $1,660. Any more losses could send the price towards the $1,550 level in the near term.
Technical Indicators
Hourly MACD – The MACD for ETH/USD is now gaining momentum in the bearish zone.
Hourly RSI – The RSI for ETH/USD is now in the oversold zone.
Major Support Level – $1,700
Major Resistance Level – $1,820