

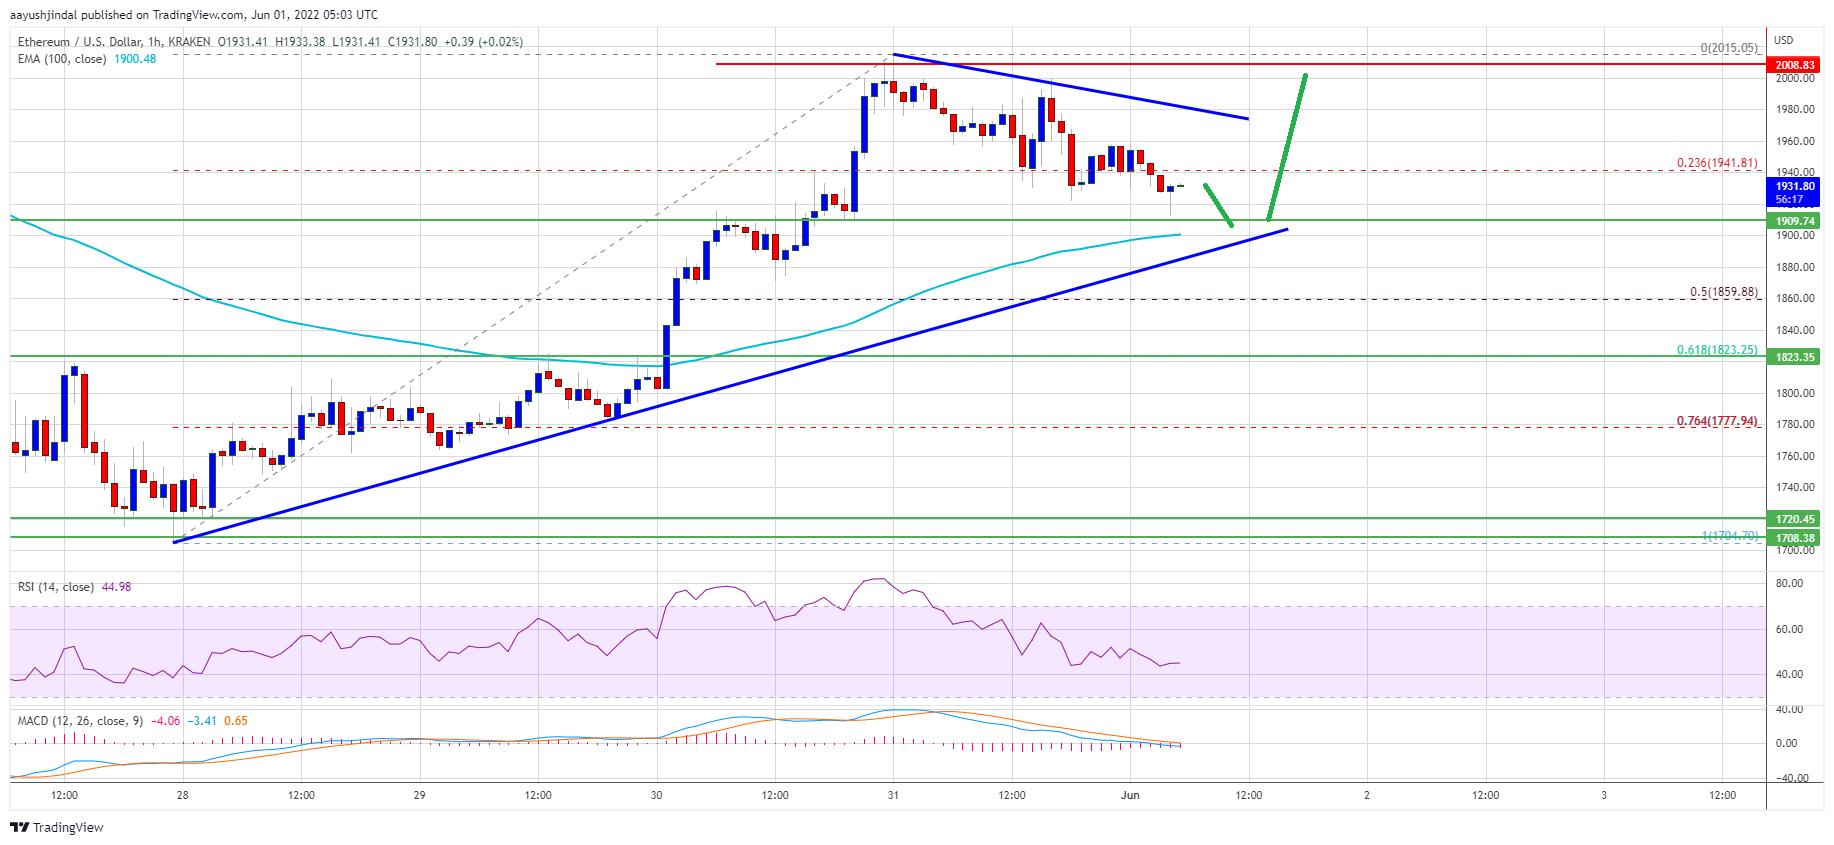
Ethereum struggled to gain pace above the $2,000 resistance against the US Dollar. ETH is correcting lower, but dips might be limited below the $1,900 zone.
- Ethereum started a downside correction from the $2,000 resistance zone.
- The price is still trading above $1,900 and the 100 hourly simple moving average.
- There is a key bullish trend line forming with support near $1,905 on the hourly chart of ETH/USD (data feed via Kraken).
- The pair could start a fresh increase if it stays above $1,900 and the 100 hourly SMA.
Ethereum Price Reaches Key Support
Ethereum attempted an upside break above the $2,000 resistance zone. However, the bulls struggled above the $2,000 level. A high was formed near $2,015 and the price started a downside correction.
There was a move below the $1,950 and $1,940 levels. Ether price dipped below the 23.6% Fib retracement level of the upward move from the $1,704 swing low to $2,015 high. However, it is still trading above $1,900 and the 100 hourly simple moving average.
There is also a key bullish trend line forming with support near $1,905 on the hourly chart of ETH/USD. On the upside, an initial resistance is near the $1,960 level.
Source: ETHUSD on TradingView.com
The next major resistance is near the $1,980 level and a connecting bearish trend line on the same chart. The main resistance is still near the $2,000 zone. A proper upside break above the $2,000 resistance might stage a fresh increase. In the stated case, ether price could rise towards the $2,100 level. Any more gains may perhaps send it towards the $2,150 resistance zone.
Downside Break in ETH?
If ethereum fails to continue higher above the $1,980 resistance, it could extend its downside correction. An initial support on the downside is near the $1,920 zone.
The next major support is near the $1,900 level and the 100 hourly simple moving average. Any more losses might call for a test of the 50% Fib retracement level of the upward move from the $1,704 swing low to $2,015 high. A downside break below the $1,850 level might send the price towards $1,800.
Technical Indicators
Hourly MACD – The MACD for ETH/USD is now losing momentum in the bullish zone.
Hourly RSI – The RSI for ETH/USD is now just below the 50 level.
Major Support Level – $1,900
Major Resistance Level – $2,000