

Bitcoin spiked below the key $28,500 support zone against the US Dollar. BTC is declining and might continue to move down towards the $27,500 support.
- Bitcoin is moving lower and facing a major resistance near the $29,600 zone.
- The price is now trading below the $29,000 level and the 100 hourly simple moving average.
- There is a major bearish trend line forming with resistance near $29,600 on the hourly chart of the BTC/USD pair (data feed from Kraken).
- The pair could continue to move down if it settles below the $28,500 support.
Bitcoin Price Faces Selling Pressure
Bitcoin price remained below the key $30,000 resistance zone. BTC started a fresh decline and there was a sharp move below the $28,500 support zone.
The bears pushed the price below the $28,000 level. The price even tested the $27,500 support and a low is formed near $27,505. However, there was a strong recovery and the price climbed above $28,500. The bulls pushed the price above $29,000, but they struggled near $29,600.
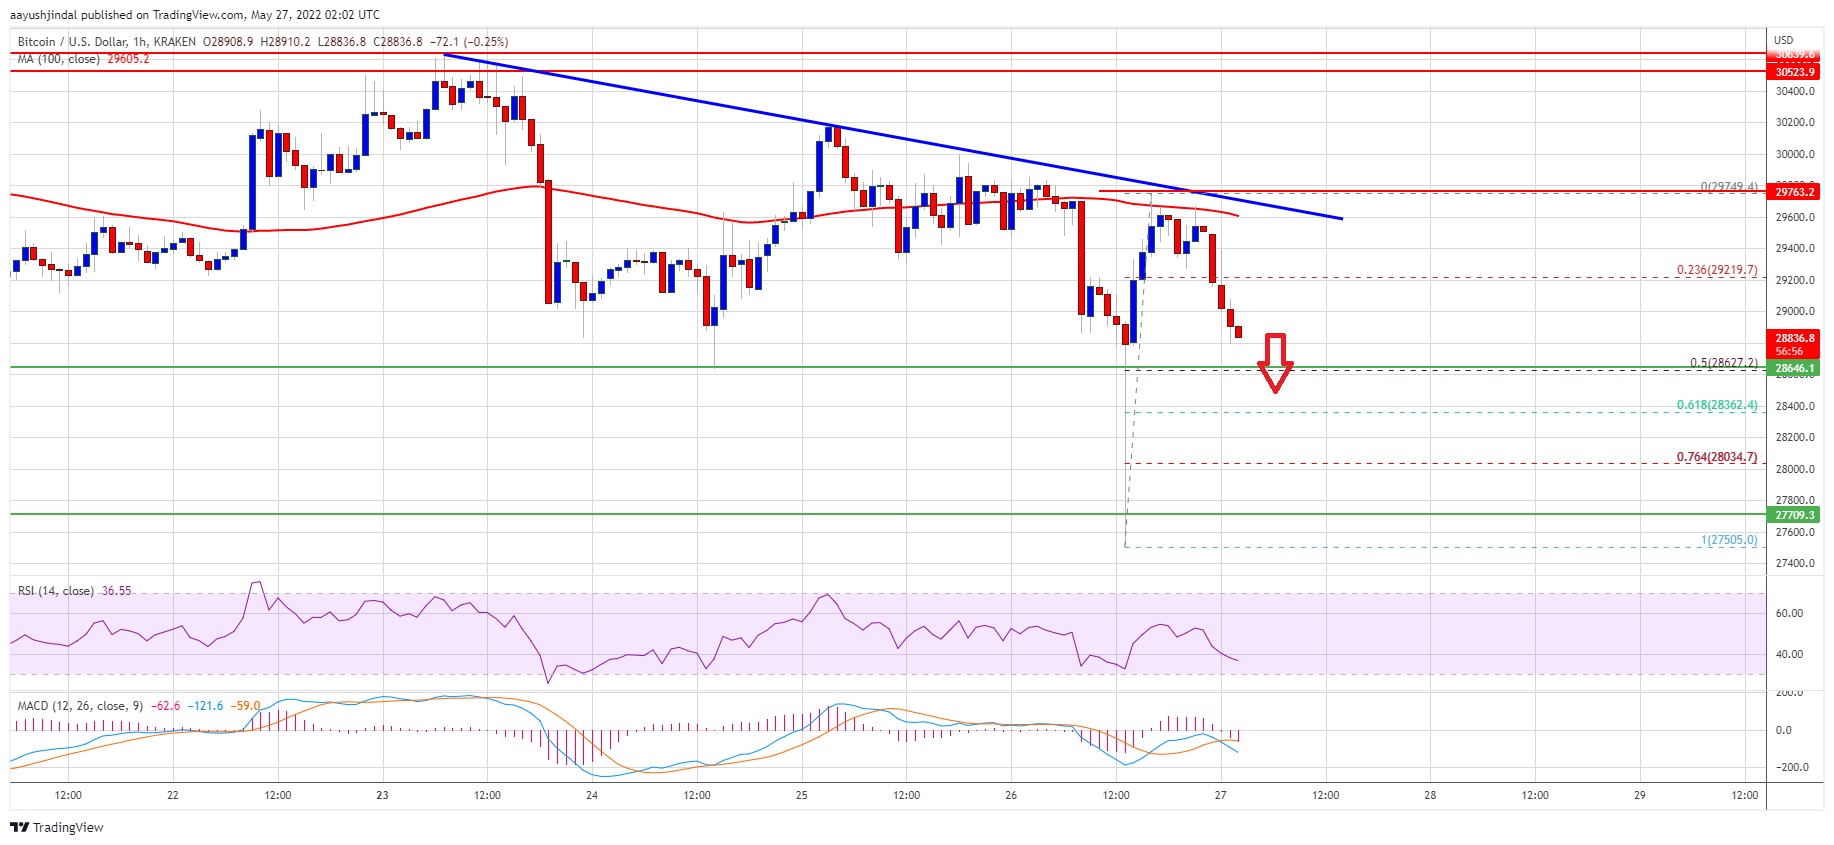
There is also a major bearish trend line forming with resistance near $29,600 on the hourly chart of the BTC/USD pair. Bitcoin traded below the 23.6% Fib retracement level of the upward move from the $27,505 swing low to $29,749 high.
It is now trading below the $29,000 level and the 100 hourly simple moving average. An immediate resistance on the upside is near the $29,250 level. The next major resistance is near the $29,600 level and the 100 hourly simple moving average.
Source: BTCUSD on TradingView.com
The main resistance sits near the $29,750. It is near the 50% Fib retracement level of the upward move from the $27,505 swing low to $29,749 high. A clear move above the $29,750 resistance level might start a strong increase. In the stated case, the price may perhaps rise towards the $30,600 resistance zone.
More Losses in BTC?
If bitcoin fails to clear the $29,600 resistance zone, it could continue to move down. An immediate support on the downside is near the $28,650 level.
The first major support is near the $28,500 level. A downside break below the $28,500 support might send the price further lower. In the stated case, the price may perhaps revisit the $27,500 support zone.
Technical indicators:
Hourly MACD – The MACD is now gaining pace in the bearish zone.
Hourly RSI (Relative Strength Index) – The RSI for BTC/USD is now below the 50 level.
Major Support Levels – $28,500, followed by $27,500.
Major Resistance Levels – $29,600, $29,750 and $30,600.