

Ethereum struggled to gain pace above the $2,000 resistance against the US Dollar. ETH is declining, but it is still above the key $1,920 support zone.
- Ethereum is showing a few bearish signs below the $2,000 barrier.
- The price is now trading below $2,000 and the 100 hourly simple moving average.
- There is a major bearish trend line forming with resistance near $1,970 on the hourly chart of ETH/USD (data feed via Kraken).
- The pair could decline sharply if there is a clear move below the $1,920 support zone.
Ethereum Price Settles Below $2K
Ethereum climbed above the $1,950 resistance and the 100 hourly simple moving average. However, the bears protected major gains above the key $2,000 zone.
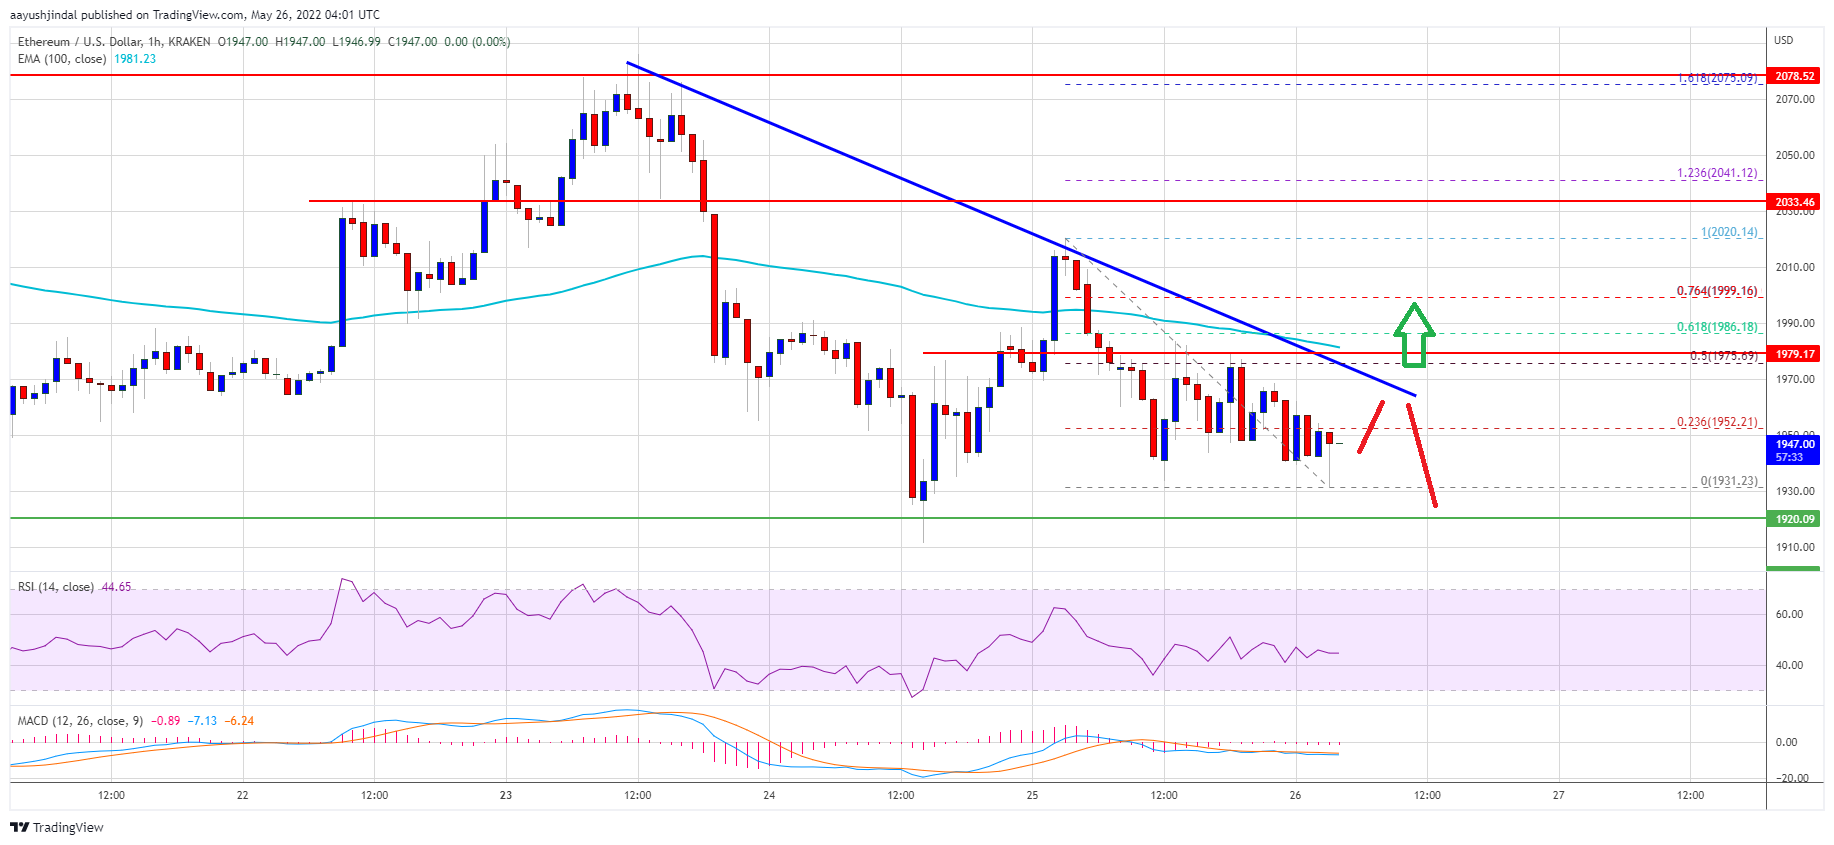
The price started a fresh decline from the $2,020 swing high. There was a clear move below the $1,980 level and $1,950. Ether is now trading below $2,000 and the 100 hourly simple moving average. A low is formed near $1,931 and the price is now consolidating losses.
On the upside, an initial resistance is near the $1,950 level. It is near the 23.6% Fib retracement level of the recent decline from the $2,020 swing high to $1,931 low.
The next major resistance is near the $1,970 level. There is also a major bearish trend line forming with resistance near $1,970 on the hourly chart of ETH/USD. The trend line is near the 50% Fib retracement level of the recent decline from the $2,020 swing high to $1,931 low.
Source: ETHUSD on TradingView.com
The main resistance is now forming near the $2,000 level. A close above the $2,000 level could open the doors for a steady increase. In the stated case, ether price could rise towards the $2,085 resistance zone. Any more gains may perhaps send it towards the key $2,200 resistance zone.
More Losses in ETH?
If ethereum fails to recover above the $2,000 resistance, it could continue to move down. An initial support on the downside is near the $1,930 zone.
The next major support is near the $1,920 level. A downside break below the $1,920 level might call for a sharp decline. In the stated case, the price could dive towards the $1,850 level. Any more losses may perhaps call for a move to $1,800.
Technical Indicators
Hourly MACD – The MACD for ETH/USD is now losing momentum in the bearish zone.
Hourly RSI – The RSI for ETH/USD is now below the 50 level.
Major Support Level – $1,920
Major Resistance Level – $2,000