

Bitcoin extended decline and traded below $29,000 against the US Dollar. BTC must stay above the $28,500 level to avoid a sharp decline in the near term.
- Bitcoin started a fresh decline from the $30,500 resistance zone.
- The price is now trading below the $30,000 level and the 100 hourly simple moving average.
- There was a break below a connecting bullish trend line with support near $29,600 on the hourly chart of the BTC/USD pair (data feed from Kraken).
- The pair could extend decline if there is a clear move below the $28,500 support zone.
Bitcoin Price Is Showing Bearish Signs
Bitcoin price failed to clear the $30,500 resistance zone and started a fresh increase. There was a clear move below the $29,500 and $29,000 support levels.
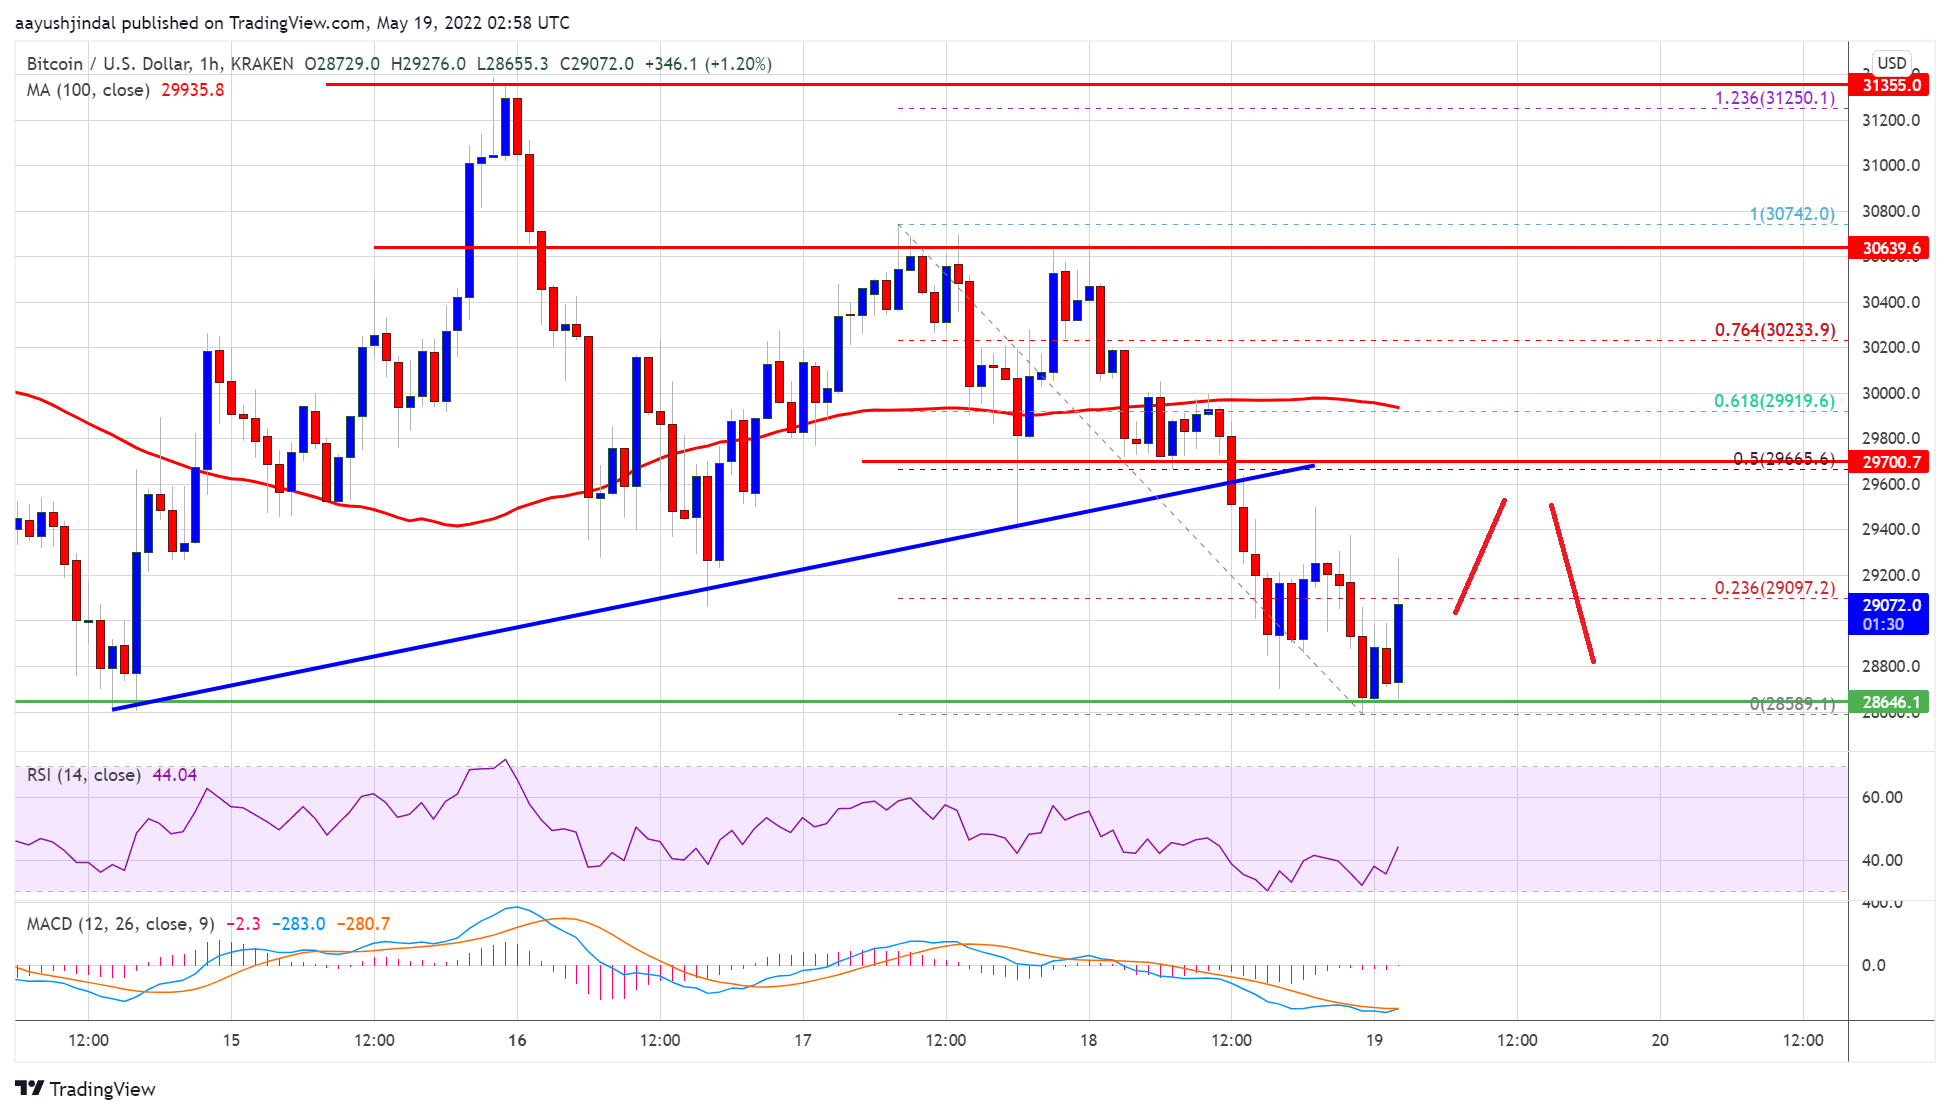
Besides, there was a break below a connecting bullish trend line with support near $29,600 on the hourly chart of the BTC/USD pair. The pair is now trading below $30,000 and the 100 hourly simple moving average. It tested the $28,500 support zone.
A low is formed near $28,589 and the price is now consolidating losses. An immediate resistance is near the $29,100 level. It is near the 23.6% Fib retracement level of the recent decline from the $30,742 swing high to $28,589 low.
Source: BTCUSD on TradingView.com
The next major resistance is near the $29,650 level. It is near the 50 Fib retracement level of the recent decline from the $30,742 swing high to $28,589 low. A clear move above the $29,500 and $29,650 resistance levels might start a fresh increase in the near term. The next key resistance could be near the $30,500 level, above which the price might rise towards $31,200.
More Losses in BTC?
If bitcoin fails to gain pace above the $29,650 resistance zone, it could continue to move down. An immediate support on the downside is near the $28,800 level.
The next major support is near the $28,500 level. A downside break and close below the $28,500 support might start a major decline. In the stated case, the price could drop towards the $27,500 level.
Technical indicators:
Hourly MACD – The MACD is now slowly losing pace in the bearish zone.
Hourly RSI (Relative Strength Index) – The RSI for BTC/USD is now below the 50 level.
Major Support Levels – $28,800, followed by $28,500.
Major Resistance Levels – $29,650, $30,000 and $30,500.