

Ethereum gained bearish momentum below $2,000 against the US Dollar. ETH even traded below $2,000 and remains at a risk of more losses.
- Ethereum started a fresh decline below $2,100 and $2,000.
- The price is now trading below $2,100 and the 100 hourly simple moving average.
- There was a break below a key bullish trend line with support near $2,250 on the hourly chart of ETH/USD (data feed via Kraken).
- The pair could continue to move down if there is a close below the $2,000 support.
Ethereum Price Breaks $2K
Ethereum failed to extend the recovery wave above the $2,400 level. ETH started another decline and traded below the $2,320 support zone.
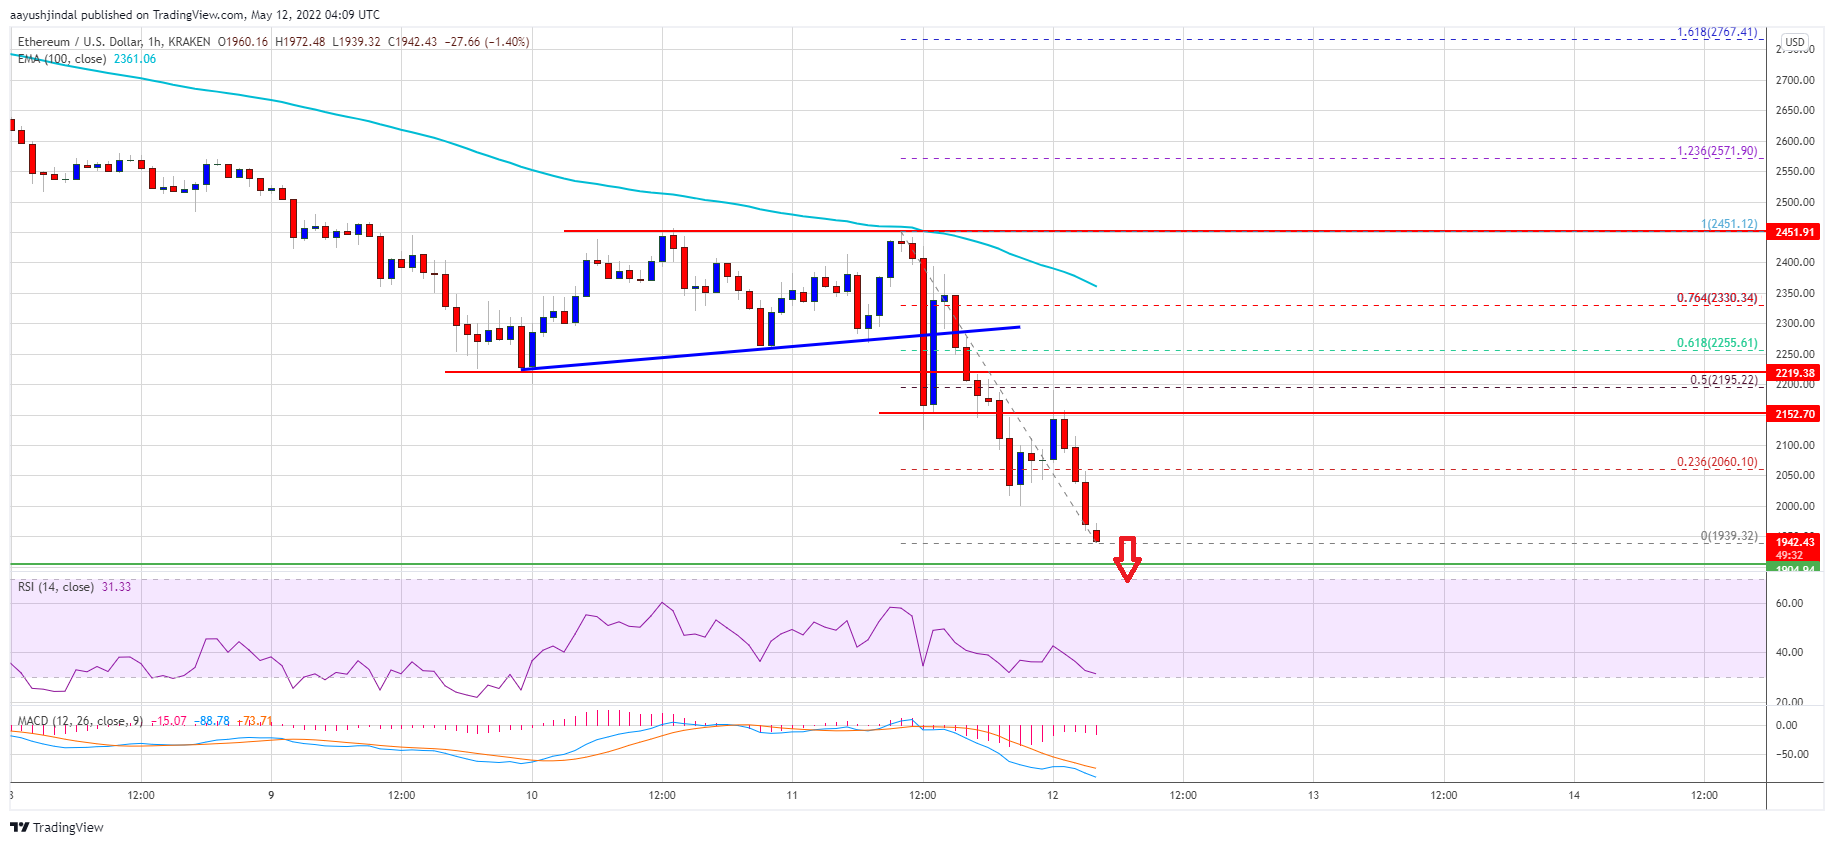
There was a break below a key bullish trend line with support near $2,250 on the hourly chart of ETH/USD. The pair tumbled below the $2,200 and $2,100 levels. Ether price even broke the $2,000 support zone and settled below the 100 hourly simple moving average.
It traded towards $1,950 and is currently showing signs of more losses. If there is a recovery wave, the price might face resistance near the $2,050 level.
The 23.6% Fib retracement level of the recent decline from the $2,451 swing high to $1,939 low is also near $2,060. The first major resistance is near the $2,150 level. The main resistance is now forming near the $2,220 level.
Source: ETHUSD on TradingView.com
The 50% Fib retracement level of the recent decline from the $2,451 swing high to $1,939 low is also near $2,200. A close above the $2,200 level could open the doors for a decent increase. In the stated case, ether price might rise towards the $2,350 resistance.
More Losses in ETH?
If ethereum fails to recover above the $2,200 resistance, it could continue to move down. An initial support on the downside is near the $1,940 zone.
The next major support is near the $1,880 level. A daily close below the $2,000 level might spark more losses below $1,880. In the stated case, the price could dive towards the $1,700 level. The next major support might be near the $1,550 and $1,500 levels in the near term.
Technical Indicators
Hourly MACD – The MACD for ETH/USD is now gaining momentum in the bearish zone.
Hourly RSI – The RSI for ETH/USD is well below the 40 level.
Major Support Level – $1,880
Major Resistance Level – $2,200