

Bitcoin extended losses and even spiked below $30,000 against the US Dollar. BTC is now consolidating and might correct higher towards the $32,000 resistance.
- Bitcoin started a strong decline below the $33,500 and $32,000 levels.
- The price is now trading below $32,000 and the 100 hourly simple moving average.
- There are two important bearish trend lines forming with resistance near $32,000 on the hourly chart of the BTC/USD pair (data feed from Kraken).
- The pair might correct higher, but the bears might remain active near $32,000.
Bitcoin Price Declines 10%
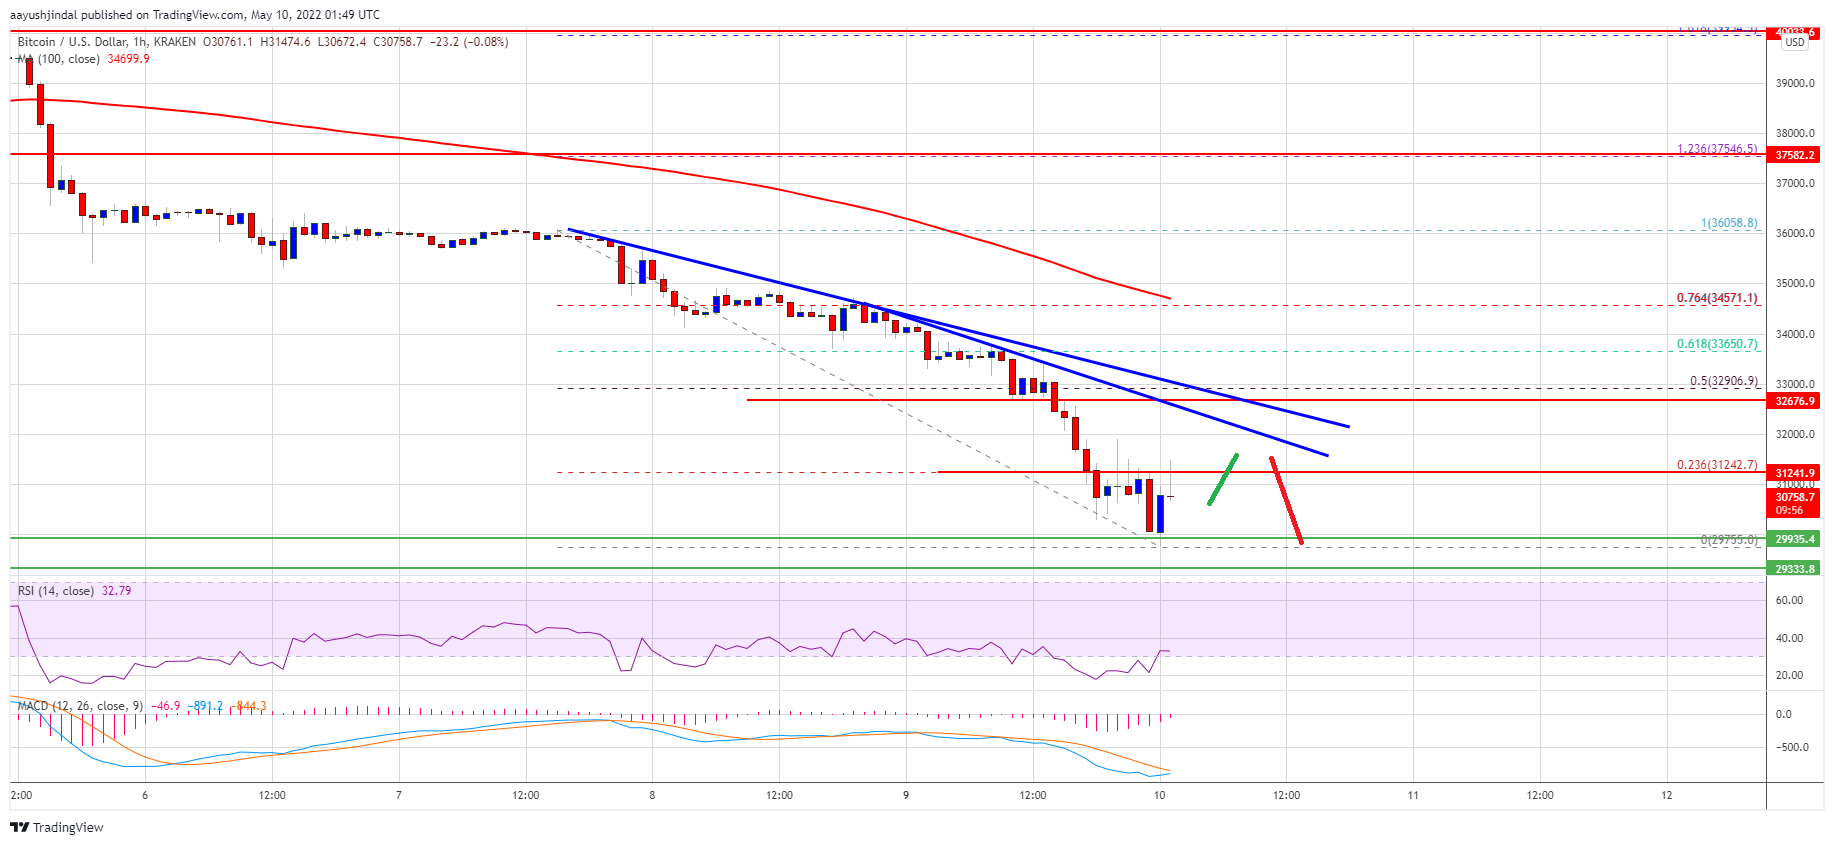
Bitcoin price remained in a major downtrend and extended downsides below the $35,000 level. BTC traded below the key $33,500 and $32,000 support levels to move further into a bearish zone.
There was a close below $32,000 and the 100 hourly simple moving average. The price even traded below the $30,800 level and spiked below $30,000. A new multi-week low is forming near $29,755 and the price is now consolidating losses.
On the upside, bitcoin price is facing resistance near the $31,250 level. It is near the 23.6% Fib retracement level of the recent decline from the $36,060 swing high to $29,755 low.
The next key resistance could be near the $32,000 level. There are two important bearish trend lines forming with resistance near $32,000 on the hourly chart of the BTC/USD pair. The key breakout zone could be near the $33,000 zone.
Source: BTCUSD on TradingView.com
The 50% Fib retracement level of the recent decline from the $36,060 swing high to $29,755 low is also near the $33,000 zone. To start a decent recovery wave, the price must settle above the $33,000 level. In the stated case, the price might rise towards the $35,000 level.
More Losses in BTC?
If bitcoin fails to clear the $32,000 resistance zone, it could continue to move down. An immediate support on the downside is near the $30,200 level.
The next major support is seen near the $30,000 level. A downside break and close below the $30,000 support might spark more downsides. The next major support could be $29,500. Any more losses might send the price towards the $28,800 support zone.
Technical indicators:
Hourly MACD – The MACD is now gaining pace in the bearish zone.
Hourly RSI (Relative Strength Index) – The RSI for BTC/USD is now below the 40 level.
Major Support Levels – $30,200, followed by $30,000.
Major Resistance Levels – $31,200, $32,000 and $33,000.