

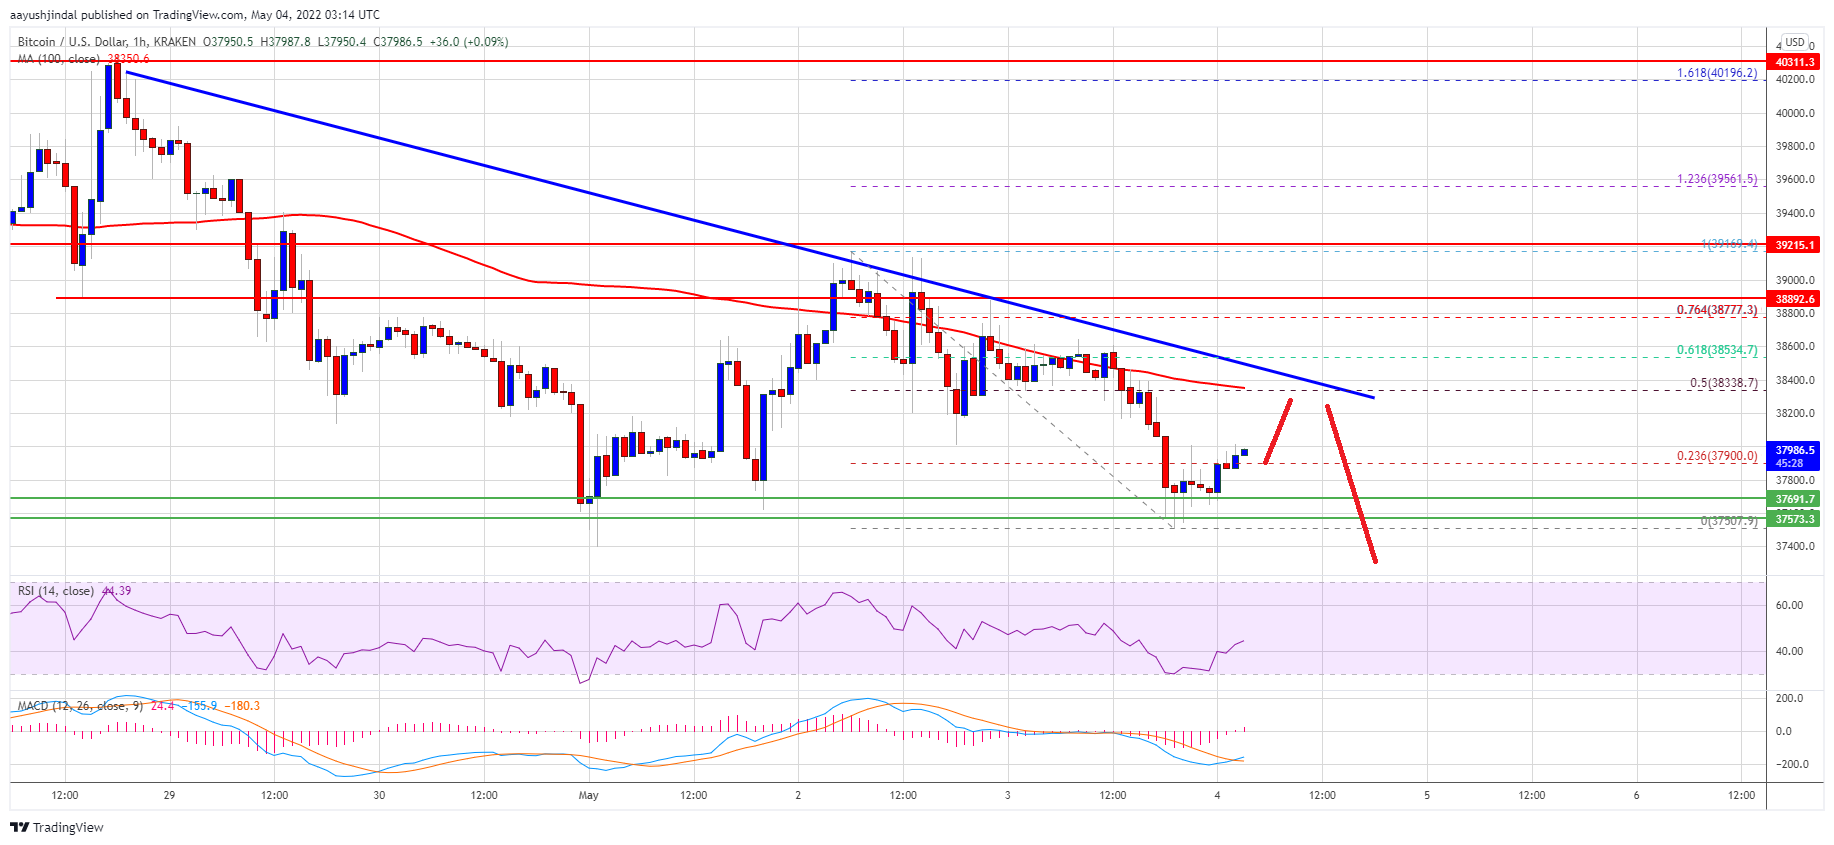
Bitcoin is facing resistance near $38,200 against the US Dollar. BTC remains at a risk of more downsides unless there is a move above the $39,000 resistance.
- Bitcoin is facing a major resistance near the $38,200 and $39,000 levels.
- The price is now trading below $38,500 and the 100 hourly simple moving average.
- There is a key bearish trend line with resistance near $38,350 on the hourly chart of the BTC/USD pair (data feed from Kraken).
- The pair must clear the $38,350 and $38,800 resistance levels to start a steady increase.
Bitcoin Price Remains In Downtrend
Bitcoin price attempted an upside break above the $38,800 and $39,000 resistance levels. However, BTC struggled to clear the $39,000 resistance zone and started a fresh decline.
A swing high was formed near $39,170 and the price started a fresh decline. There was a clear move below the $38,800 and $38,500 levels. The bears even pushed the price below the $38,000 level and there was a close below the 100 hourly simple moving average.
A low is formed near $37,507 and the price is now correcting losses. There was a move above the 23.6% Fib retracement level of the recent decline from the $39,169 swing high to $37,507 low.
Bitcoin price is now facing resistance near the $38,350 level and the 100 hourly simple moving average. There is also a key bearish trend line with resistance near $38,350 on the hourly chart of the BTC/USD pair. The trend line is near the 50% Fib retracement level of the recent decline from the $39,169 swing high to $37,507 low.
Source: BTCUSD on TradingView.com
The next key resistance could be near the $38,800 zone. A close above the $38,800 resistance could increase the chances of a clear move above the $39,000 resistance zone.
More Losses in BTC?
If bitcoin fails to clear the $38,350 resistance zone, it could continue to move down. An immediate support on the downside is near the $37,700 level.
The next major support is seen near the $37,550 level. A downside break below the $37,550 support and the recent low might trigger sharp losses. The next major support is $36,500, below which the price could dive to $35,000.
Technical indicators:
Hourly MACD – The MACD is slowly losing pace in the bearish zone.
Hourly RSI (Relative Strength Index) – The RSI for BTC/USD is now below the 50 level.
Major Support Levels – $37,700, followed by $37,550.
Major Resistance Levels – $38,350, $38,800 and $39,000.