

Ethereum gained bearish momentum below the $3,100 level against the US Dollar. ETH price extended decline and settled below the $3,000 support zone.
- Ethereum started another decline and traded below the key $3,000 support.
- The price is now trading below $3,050 and the 100 hourly simple moving average.
- There is a connecting bearish trend line forming with resistance near $2,990 on the hourly chart of ETH/USD (data feed via Kraken).
- The pair could recover, but upsides might be capped near the $3,035 level.
Ethereum Price Extends Decline
Ethereum remained in a bearish zone below the $3,120 level. ETH broke the key $3,000 support zone to move further into a bearish zone.
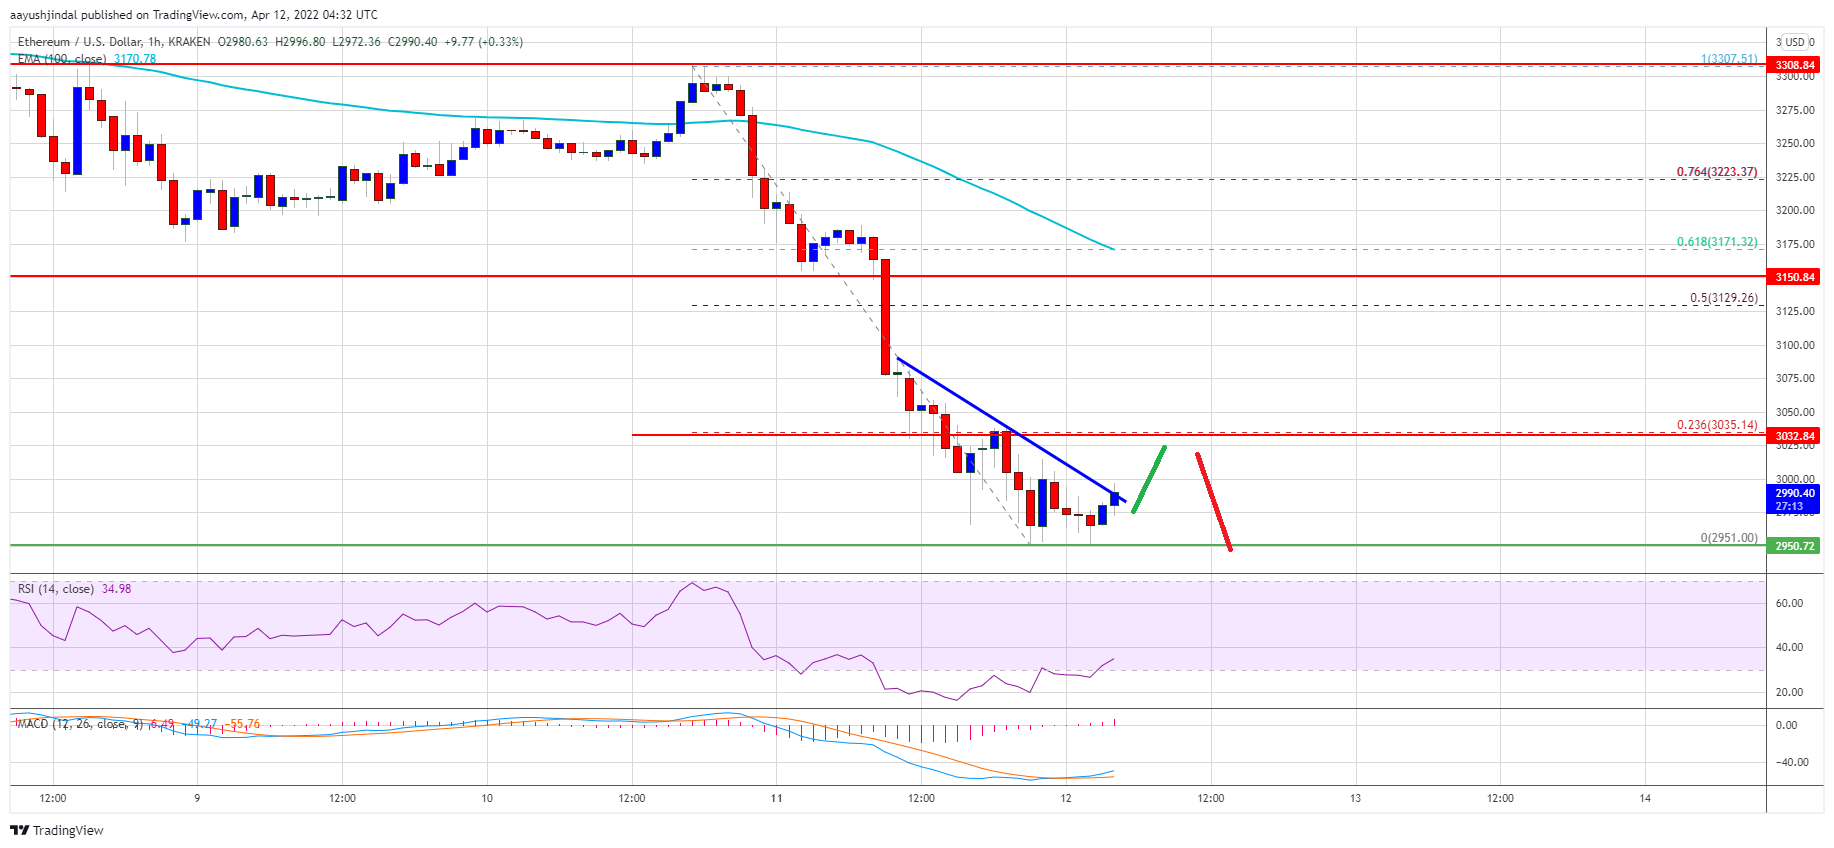
The bears even pushed the price below $2,980. A low is formed near $2,951 and the price is now consolidating losses. Besides, ether price now trading below $3,050 and the 100 hourly simple moving average. On the upside, an initial resistance is seen near the $2,990 level.
There is also a connecting bearish trend line forming with resistance near $2,990 on the hourly chart of ETH/USD. The next major resistance is near the $3,035 level. It is near the 23.6% Fib retracement level of the recent decline from the $3,308 swing high to $2,951 low.
A close above the $3,035 level might start a decent recovery wave. The next major resistance could be near the $3,130 level. The 50% Fib retracement level of the recent decline from the $3,308 swing high to $2,951 low is also near $3,130.
Source: ETHUSD on TradingView.com
A clear move above the $3,130 resistance could increase the chances of a trend change. In the stated case, the price could climb above the $3,150 zone.
More Losses in ETH?
If ethereum fails to start a recovery wave above the $3,035 level, it could continue to move down. An initial support on the downside is near the $2,965 zone.
The next major support is near the $2,950 level. If there is a downside break below the $2,950 support, the price could resume its decline. In the stated case, the price could drop towards the $2,820 level or even $2,800 in the near term.
Technical Indicators
Hourly MACD – The MACD for ETH/USD is slowly losing pace in the bearish zone.
Hourly RSI – The RSI for ETH/USD is now correcting higher towards the 40 level.
Major Support Level – $2,950
Major Resistance Level – $3,035