

Bitcoin started a fresh decline from the $43,400 zone against the US Dollar. BTC remains at a risk of more downsides below the $41,500 level.
- Bitcoin started a fresh decline after it failed to surpass $43,400.
- The price is now trading below $42,200 and the 100 hourly simple moving average.
- There is a key bearish trend line forming with resistance near $43,200 on the hourly chart of the BTC/USD pair (data feed from Kraken).
- The pair could start a strong decline if there is a clear move below the $41,500 level.
Bitcoin Price Turns Red
Bitcoin price attempted an upside correction above the $42,500 level. BTC climbed above the $43,000 level, but it faced a strong selling interest near $43,400.
The price also struggled to stay above the $43,000 level and the 100 hourly simple moving average. As a result, there was a fresh decline below the $42,500 support zone. The price gained bearish momentum and traded below $42,000.
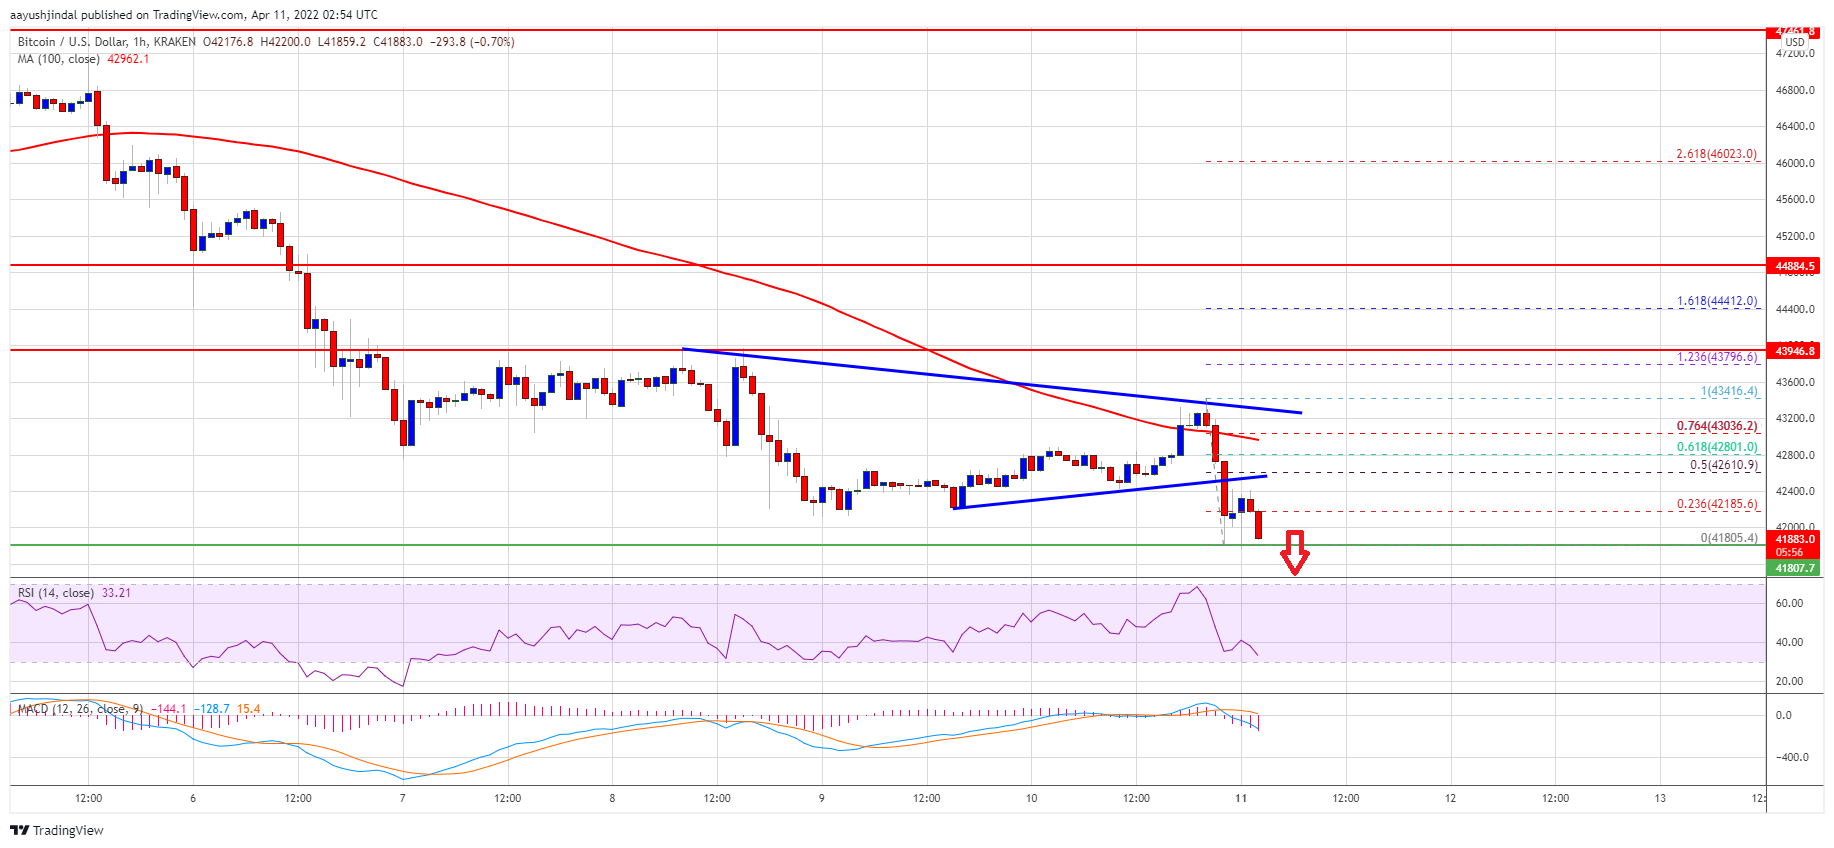
It is now trading below $42,200 and the 100 hourly simple moving average. There is also a key bearish trend line forming with resistance near $43,200 on the hourly chart of the BTC/USD pair.
A low is formed near $41,805 and the price is now consolidating losses. An immediate resistance on the upside is near the $42,185 level. It is close to the 23.6% Fib retracement level of the recent decline from the $43,416 swing high from the $41,805 low.
The next resistance could be near $42,600. It is near a pivot zone and the 50% Fib retracement level of the recent decline from the $43,416 swing high from the $41,805 low. The main resistance is now forming near $43,000 and the 100 hourly SMA.
Source: BTCUSD on TradingView.com
Bitcoin price must clear the $42,600 and $43,000 resistance levels to start a decent increase. In the stated case, the price may perhaps rise towards the $43,600 resistance zone.
More Losses in BTC?
If bitcoin fails to clear the $43,000 resistance zone, it could continue to move down. An immediate support on the downside is near the $41,800 level.
The next major support is seen near the $41,500 level. A downside break below the $41,500 support zone could accelerate losses. In the stated case, the price could drop towards the $40,500 support in the near term. The next major support might be $40,000.
Technical indicators:
Hourly MACD – The MACD is now gaining pace in the bearish zone.
Hourly RSI (Relative Strength Index) – The RSI for BTC/USD is now below the 50 level.
Major Support Levels – $41,500, followed by $40,500.
Major Resistance Levels – $42,600, $43,000 and $43,600.