

Ethereum extended decline below the $2,525 support zone against the US Dollar. ETH price remained bid near $2,500 and currently attempting an upside break.
- Ethereum is still struggling to clear the $2,600 and $2,625 resistance levels.
- The price is now trading below $2,600 and the 100 hourly simple moving average.
- There is a key bearish trend line forming with resistance near $2,580 on the hourly chart of ETH/USD (data feed via Kraken).
- The pair could start a fresh decline if it fails to clear $2,625.
Ethereum Price Faces Hurdles
Ethereum started a fresh decline from well the $2,625 zone. ETH traded below the $2,550 and $2,525 support levels to move into the red zone.
The price even spiked below $2,500 and settled below the 100 hourly simple moving average. Ether price traded as low as $2,486 and recently recovered sharply. There was a clear move above the $2,525 and $2,550 resistance levels.
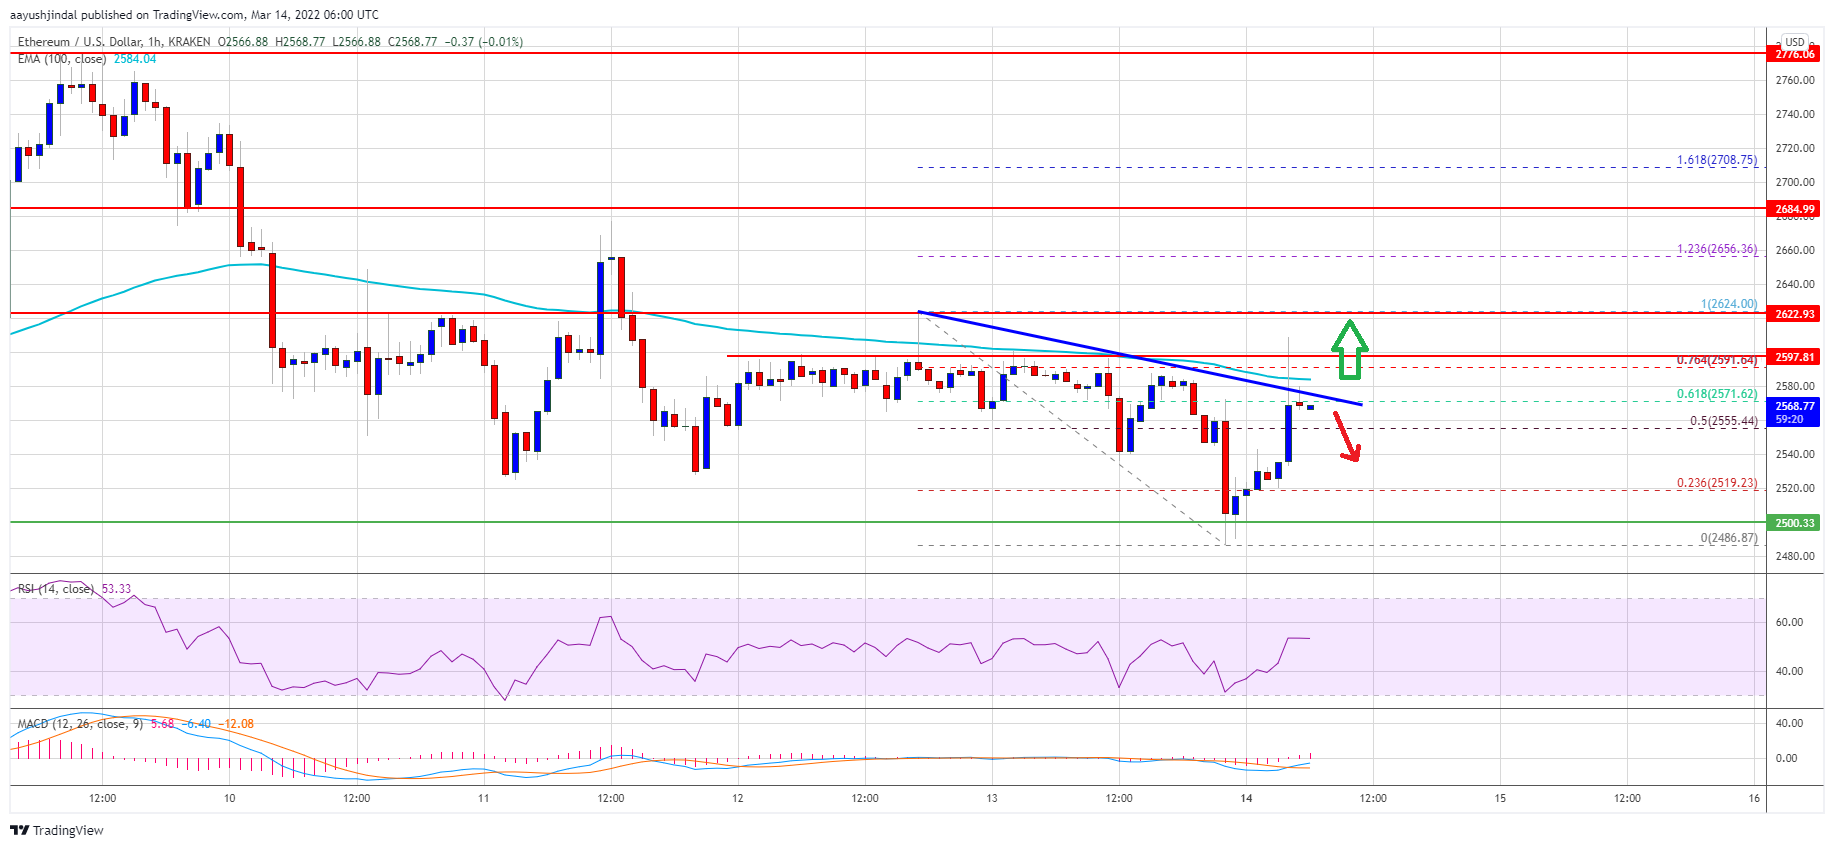
The bulls pumped the price above the 50% Fib retracement level of the recent decline from the $2,624 swing high to $2,486 low. It is now facing resistance near the $2,580 level.
There is also a key bearish trend line forming with resistance near $2,580 on the hourly chart of ETH/USD. The trend line is close to the 61.8% Fib retracement level of the recent decline from the $2,624 swing high to $2,486 low.
Source: ETHUSD on TradingView.com
The first major resistance is seen near the $2,625 level. The next major resistance is near the $2,650 level. A close above the $2,650 resistance could start a steady increase. In the stated case, the price might rise towards the $2,750 level.
Fresh Decline in ETH?
If ethereum fails to start a fresh increase above the $2,625 level, it could start another decline. An initial support on the downside is near the $2,550 level.
The next major support is near the $2,500 level. A close below the $2,500 support zone could even push the price below $2,480. The next major support might be near the $2,420 level, where the bulls might take a stand. If they fail, there is a risk of a move towards the $2,350 level.
Technical Indicators
Hourly MACD – The MACD for ETH/USD is now gaining pace in the bullish zone.
Hourly RSI – The RSI for ETH/USD is now above the 50 level.
Major Support Level – $2,500
Major Resistance Level – $2,650