

Bitcoin gained bearish momentum below $40,000 against the US Dollar. BTC is at risk of more downsides towards the $37,200 and $36,600 levels.
- Bitcoin started another decline below the $40,000 and $39,000 levels.
- The price is trading below $39,000 and the 100 hourly simple moving average.
- There is a key bearish trend line forming with resistance near $39,000 on the hourly chart of the BTC/USD pair (data feed from Kraken).
- The pair might continue to move down unless the bulls able to push the price above $39,550.
Bitcoin Price Extends Decline
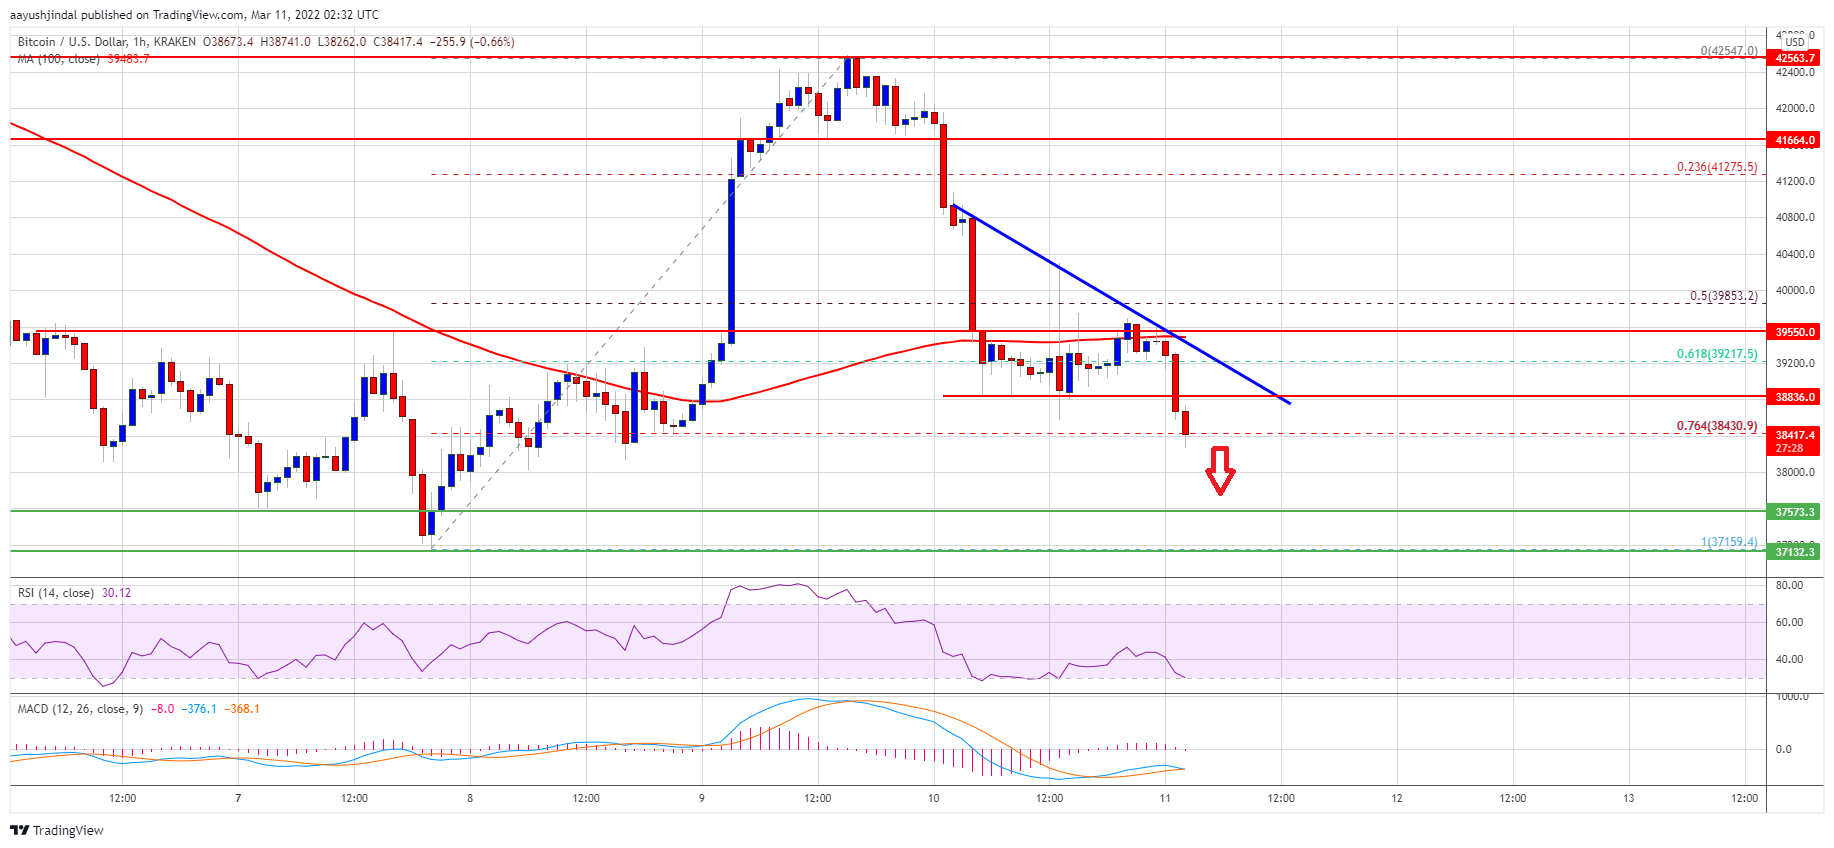
Bitcoin price struggled to stay above the $40,000 support zone. As a result, BTC extended decline below the $39,550 support zone and the 100 hourly simple moving average.
The price traded below the 61.8% Fib retracement level of the main increase from the $37,160 swing low to $42,550 swing high. It is now showing a few bearish signs below the $39,200 and $39,000 support levels.
Bitcoin is also testing the 76.4% Fib retracement level of the main increase from the $37,160 swing low to $42,550 swing high at $38,430. If there is a minor recovery wave, the price might face resistance near the $38,850 level. The first major resistance on the upside is near the $39,000 zone.
There is also a key bearish trend line forming with resistance near $39,000 on the hourly chart of the BTC/USD pair. If there is a clear move above the $39,000 resistance zone, the price might rise further.
Source: BTCUSD on TradingView.com
The next major resistance sits near the $39,550 level and the 100 hourly SMA, above which there are chances of a steady recovery wave above the $40,000 resistance zone.
More Losses in BTC?
If bitcoin fails to clear the $39,550 resistance zone, it could continue to move down. An immediate support on the downside is near the $38,400 zone.
The next major support is seen near the $38,000 level. The main support sits near the last swing low at $37,140. If there is a downside break below the $37,140 support, the price might gain bearish momentum. In the stated case, it could dive towards the $36,600 level or even $36,000.
Technical indicators:
Hourly MACD – The MACD is now gaining pace in the bearish zone.
Hourly RSI (Relative Strength Index) – The RSI for BTC/USD is now below the 50 level.
Major Support Levels – $38,000, followed by $37,140.
Major Resistance Levels – $39,000, $39,550 and $40,000.