

Ethereum extended decline below the $3,000 support against the US Dollar. ETH price tested the $2,850 support, below which it could nosedive.
- Ethereum started a sharp decline below the $3,000 support level.
- The price is now trading below $2,950 and the 100 hourly simple moving average.
- There was a break below a key bullish trend line with support near $3,065 on the hourly chart of ETH/USD (data feed via Kraken).
- The pair could extend losses if it fails to stay above the USD 2,850 support.
Ethereum Price Dive To Major Support
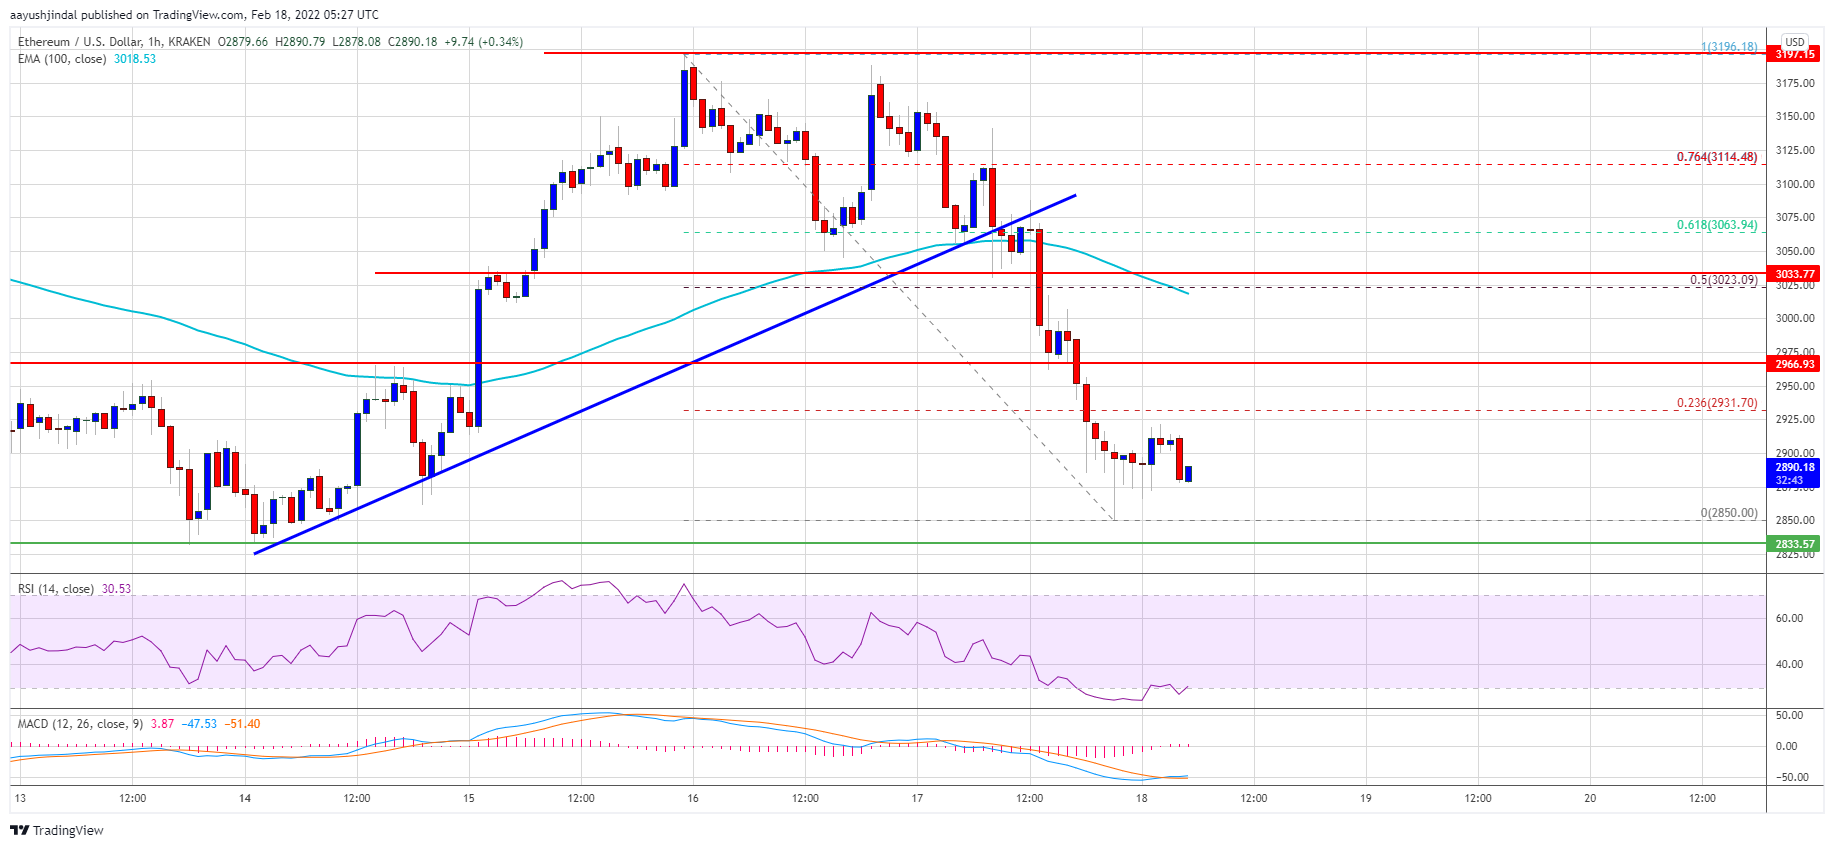
Ethereum failed to stay above the $3,000 support zone and extended decline. ETH remained below $3,000 and broke the $2,950 support zone. The decline gained pace below the $2,900 level and the 100 hourly simple moving average.
More importantly, there was a break below a key bullish trend line with support near $3,065 on the hourly chart of ETH/USD. The pair spiked below the $2,880 level and tested the main $2,850 support level.
A low is formed near $2,850 and the price is now consolidating losses. An immediate resistance on the upside is near the $2,920 level. The first major resistance is near the $2,930 level. It is near the 23.6% Fib retracement level of the recent slide from the $3,196 swing low to $2,850 low.
The next major resistance is near the $2,965 level. A clear move above the $2,965 might send the price to $3,000. The 50% Fib retracement level of the recent slide from the $3,196 swing low to $2,850 low is also near the $3,020 resistance zone.
Source: ETHUSD on TradingView.com
A successful close above $3,020 might start a steady increase. In the stated case, the price could rise towards $3,200.
More Losses in ETH?
If ethereum fails to start a recovery wave above the $2,965 level, it could continue to move down. An initial support on the downside is near the $2,880 level.
The next major support is near the $2,850 level. A downside break below the $2,850 could spark another major decline. The next major support is near the $2,800 level. Any more losses might call for a move towards $2,720.
Technical Indicators
Hourly MACD – The MACD for ETH/USD is gaining pace in the bearish zone.
Hourly RSI – The RSI for ETH/USD is now below the 40 level.
Major Support Level – $2,850
Major Resistance Level – $2,965