

Bitcoin struggled to clear the $38,800 resistance zone against the US Dollar. BTC is moving lower and might decline below the $35,000 support level.
- Bitcoin started an upside correction but failed to clear the $38,800 resistance zone.
- The price is now trading below $37,500 and the 100 hourly simple moving average.
- There was a break below a key bullish trend line with support near $37,650 on the hourly chart of the BTC/USD pair (data feed from Kraken).
- The pair could continue to move down if it stays below the $38,000 resistance zone.
Bitcoin Price Starts Fresh Decrease
Bitcoin price recovered above the $37,000 resistance zone. BTC even climbed above the $38,000 resistance zone and the 100 hourly simple moving average.
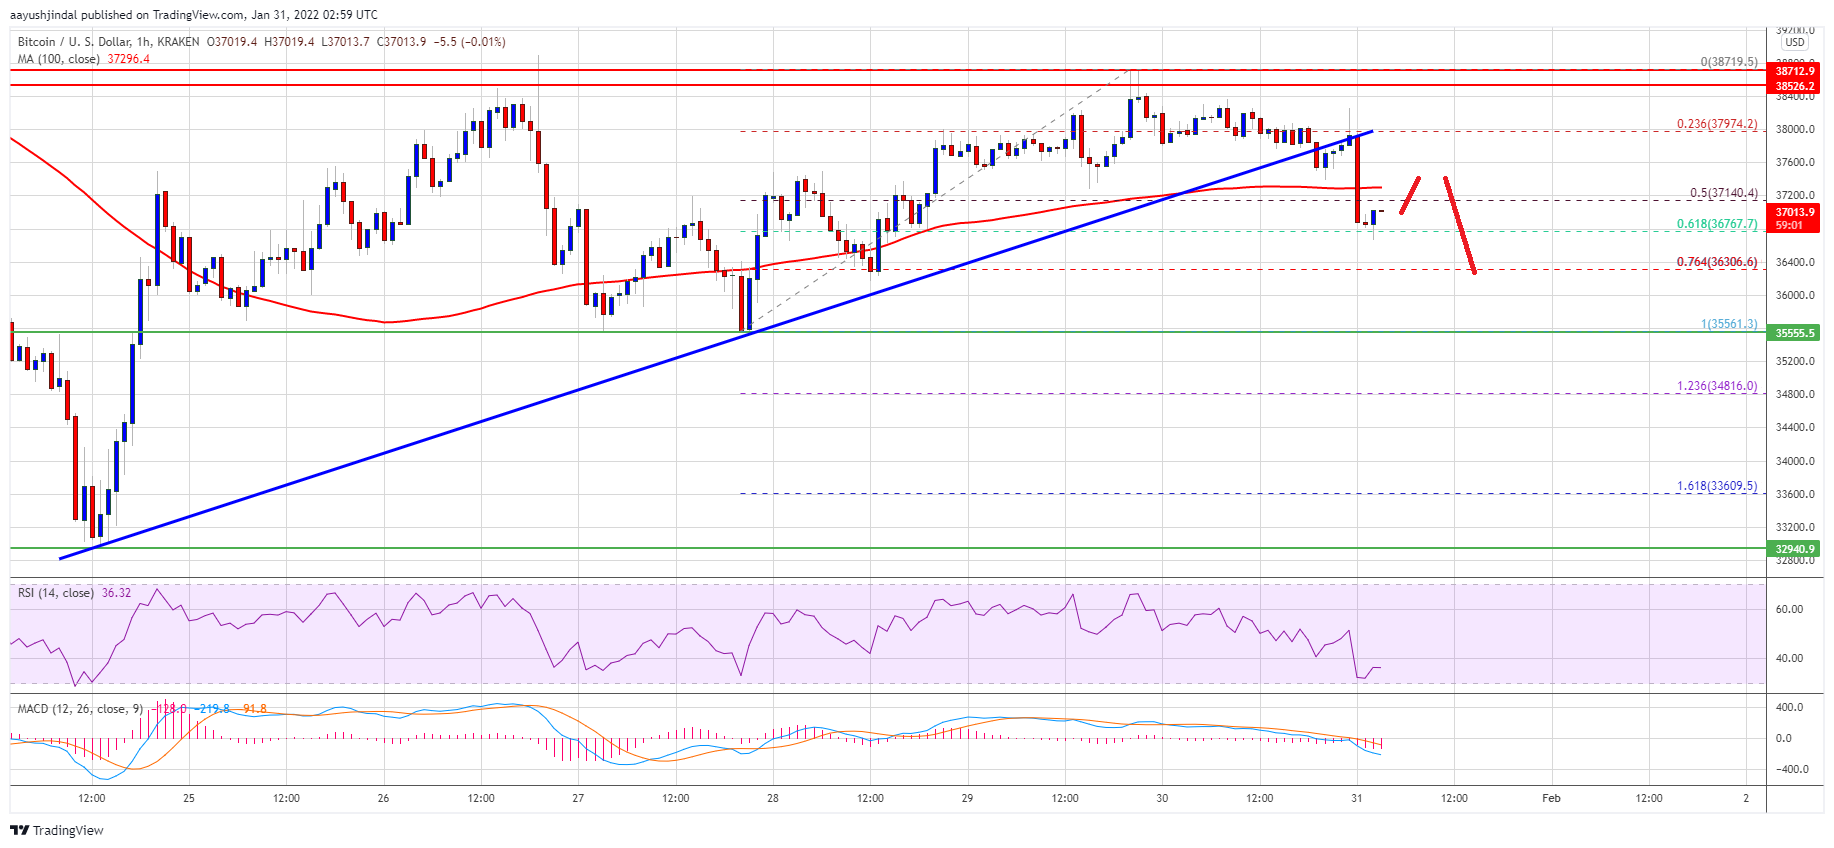
However, the price failed to clear the $38,800 resistance zone. A high was formed near $38,719 and the price started a fresh decline. There was a move below the $38,000 support level. The bears pushed the price below the 50% Fib retracement level of the upward move from the $35,561 swing low to $38,719 high.
Besides, there was a break below a key bullish trend line with support near $37,650 on the hourly chart of the BTC/USD pair. The pair traded below $37,200 and the 100 hourly simple moving average.
It is now testing the $36,800 support zone. The stated level is near the 61.8% Fib retracement level of the upward move from the $35,561 swing low to $38,719 high. On the upside, an initial resistance is near the $37,400 level and the 100 hourly SMA.
Source: BTCUSD on TradingView.com
The first major resistance is near the $38,000 zone. The main resistance is still near the $38,800 zone. An upside break above the $38,800 resistance could start a steady upward move. The next key resistance is near the $40,000 level, above which the bulls might gain strength.
More Losses in BTC?
If bitcoin fails to start a fresh increase above $38,000, it could continue to move down. An immediate support on the downside is near the $36,000 zone.
The first major support is seen near the $35,500 zone. A downside break below the $35,500 support zone may perhaps push the price towards the $34,000 support zone.
Technical indicators:
Hourly MACD – The MACD is now gaining pace in the bearish zone.
Hourly RSI (Relative Strength Index) – The RSI for BTC/USD is now below the 50 level.
Major Support Levels – $36,500, followed by $35,500.
Major Resistance Levels – $37,400, $38,000 and $38,800.