

Ethereum is recovering losses above $2,400 against the US Dollar. ETH price is rising, but it must clear $2,550 for a steady increase.
- Ethereum is slowly moving higher towards the $2,500 and $2,550 resistance levels.
- The price is trading below $2,500 and the 100 hourly simple moving average.
- There was a move above a major bearish trend line with resistance near $2,500 on the hourly chart of ETH/USD (data feed via Kraken).
- The pair could rise steadily if there is a clear move above the $2,550 resistance zone.
Ethereum Price Faces Resistance
Ethereum found support near $2,150 and started a decent recovery wave. ETH was able to climb above the $2,250 and $2,350 resistance levels.
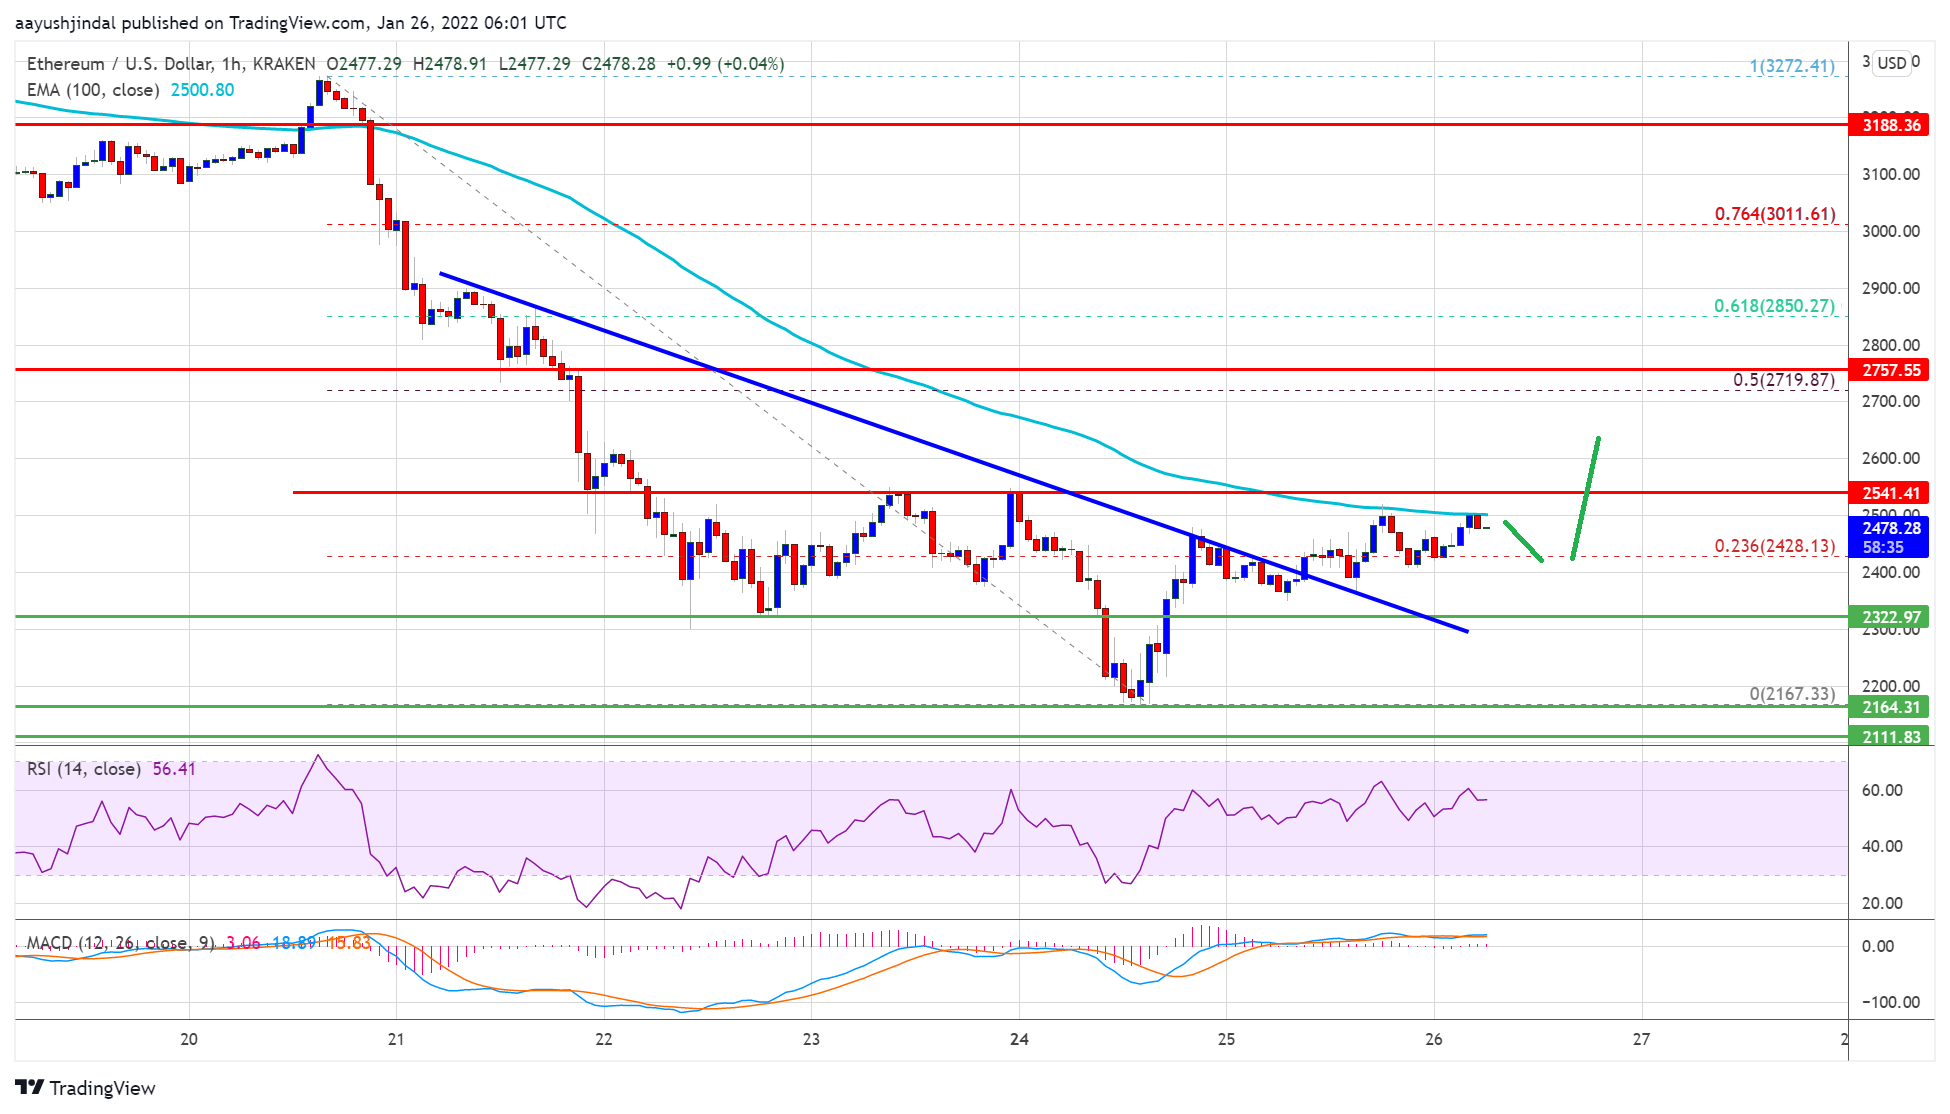
There was a clear move above the 23.6% Fib retracement level of the recent decline from the $2,547 swing high to $2,160 low. Besides, there was a move above a major bearish trend line with resistance near $2,500 on the hourly chart of ETH/USD.
The pair is still trading below $2,500 and the 100 hourly simple moving average. An immediate resistance on the upside is near the $2,500 level.
The first major resistance is near the $2,550 level. A clear move above the $2,550 resistance might start a steady increase. In the stated case, the pair could rise towards the $2,720 level. It is near the 50% Fib retracement level of the recent decline from the $2,547 swing high to $2,160 low.
Source: ETHUSD on TradingView.com
If there is an upside break above $2,720 resistance, zone, the price could gain bullish momentum. The next major resistance is near the $2,850 level. Any more gains might send ether price to $3,000.
Fresh Dip in ETH?
If ethereum fails to start a recovery wave above the $2,500 level, it could start a fresh decline. An initial support on the downside is near the $2,420 level.
The first key support is now forming near the $2,320 level. A downside break below the $2,320 level might spark a sharp decline. The next major support for the bulls may perhaps be near the $2,200 zone. Any more losses could push the price towards the $2,150 level.
Technical Indicators
Hourly MACD – The MACD for ETH/USD is losing pace in the bullish zone.
Hourly RSI – The RSI for ETH/USD is now above the 50 level.
Major Support Level – $2,320
Major Resistance Level – $2,550