

Bitcoin failed to clear the $50,000 resistance zone against the US Dollar. BTC is sliding and there is a risk of more downsides below $47,000.
- Bitcoin made two attempts to clear the $49,500 resistance but failed.
- The price is now trading below $48,500 and the 100 hourly simple moving average.
- There is a connecting bullish trend line forming with support near $47,500 on the hourly chart of the BTC/USD pair (data feed from Kraken).
- The pair could decline heavily if there is a clear break below the $47,500 support zone.
Bitcoin Price Tops Near $49,500
Bitcoin price started a recovery wave above the $48,500 resistance zone. However, BTC failed to clear the $49,500 resistance zone. It made two attempts to clear $49,500, but there was no clear break.
As a result, there was a bearish reaction below the $48,500 level. The price declined below the 50% Fib retracement level of the upward move from the $46,662 swing low to $49,512 high. It is now trading below $48,500 and the 100 hourly simple moving average.
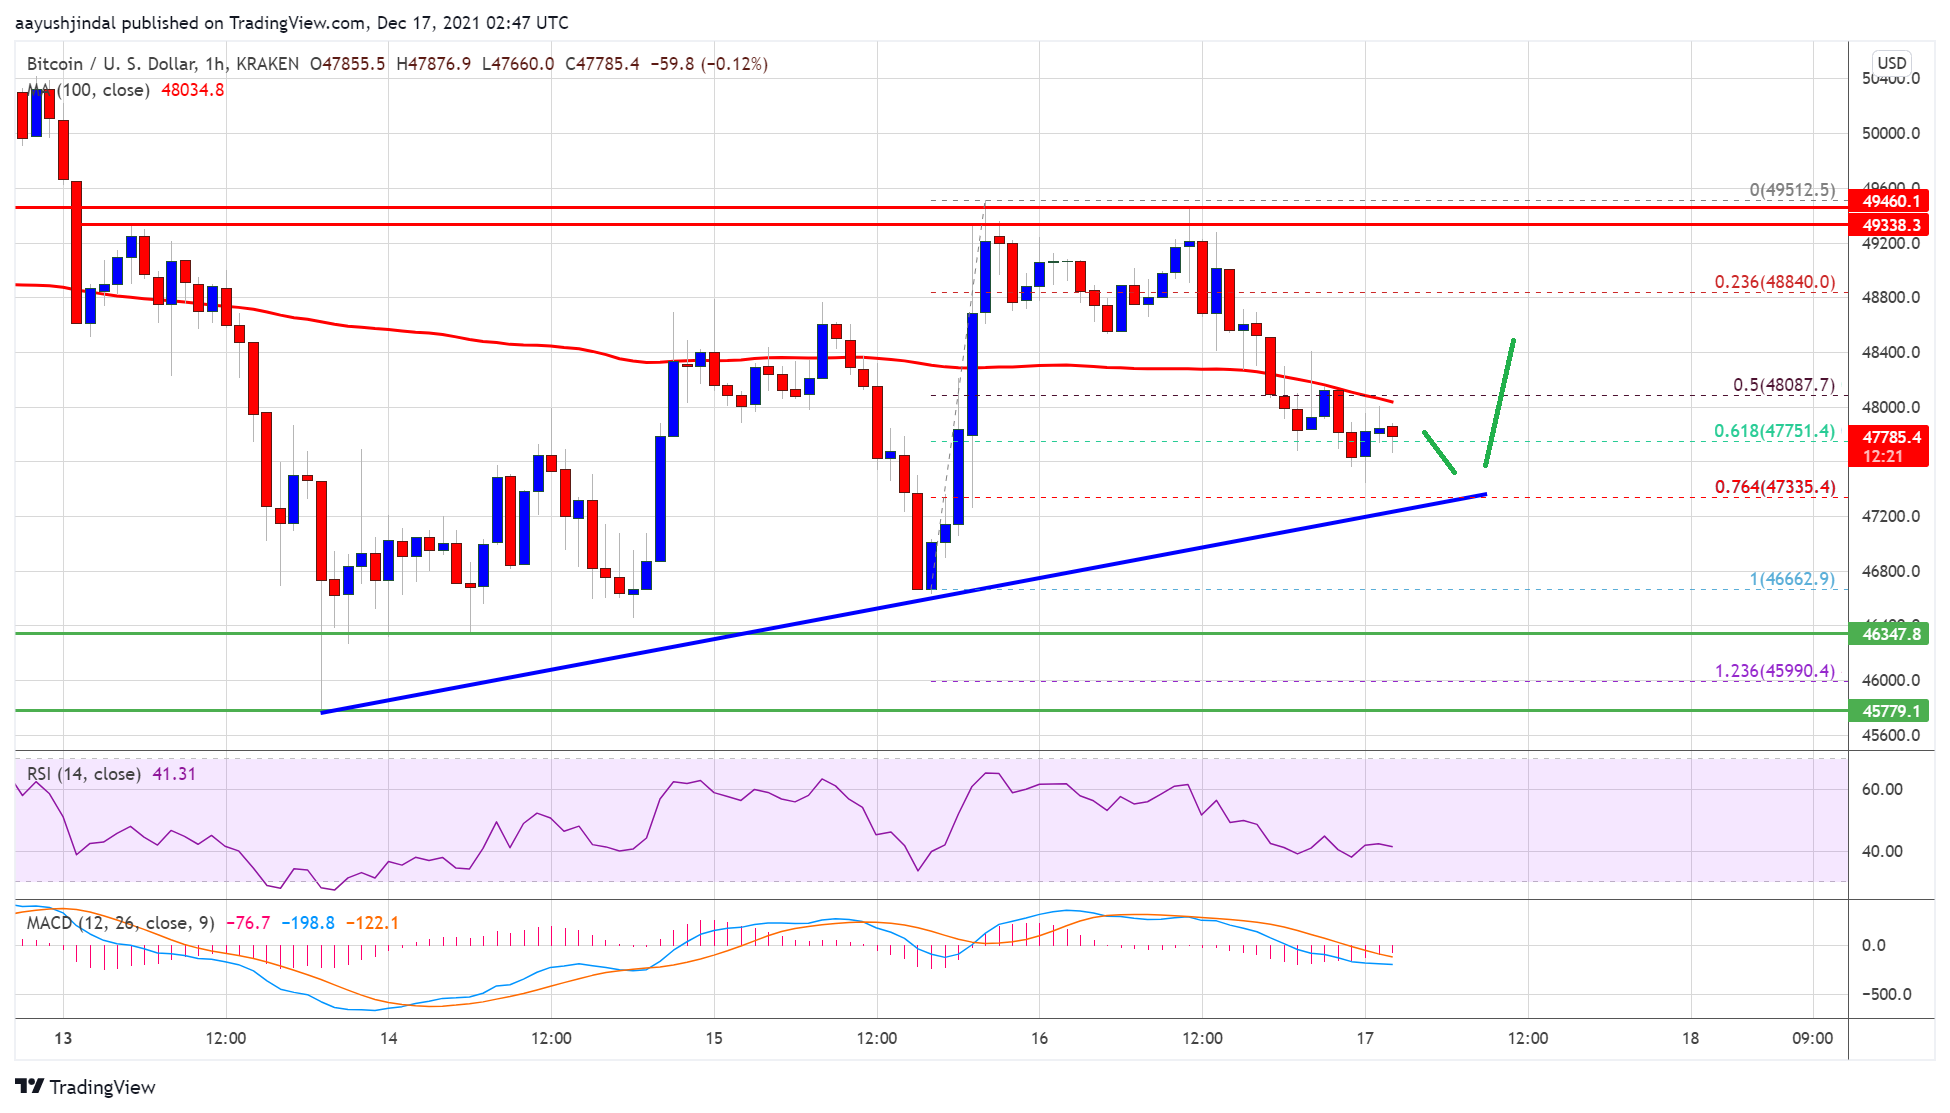
Bitcoin price is now trading near the 76.4% Fib retracement level of the upward move from the $46,662 swing low to $49,512 high. There is also a connecting bullish trend line forming with support near $47,500 on the hourly chart of the BTC/USD pair.
Source: BTCUSD on TradingView.com
On the upside, the first major resistance is near the $48,000 level and the 100 hourly SMA. The next key resistance could be $48,500. The main hurdle is still near $49,500, above which the price could attempt an upside break above the $50,000 level in the near term.
Dips Limited In BTC?
If bitcoin fails to clear the $48,500 resistance zone, it could extend decline. An immediate support on the downside is near the $47,600 level.
The first major support is now forming near the $47,500 level and the trend line. If there is a downside break below the trend line, the price might dive towards the $46,500 level. The next major support is near $45,800, below which there is a risk of a sharp decline.
Technical indicators:
Hourly MACD – The MACD is slowly losing pace in the bearish zone.
Hourly RSI (Relative Strength Index) – The RSI for BTC/USD is currently below the 50 level.
Major Support Levels – $47,500, followed by $46,500.
Major Resistance Levels – $48,500, $49,500 and $50,000.