

Bitcoin price extended its rally above the $42,000 resistance. BTC is now correcting gains and might test the $40,800 support zone.
- Bitcoin surged further above the $41,200 and $42,000 levels.
- The price is trading above $41,200 and the 100 hourly Simple moving average.
- There is a major bullish trend line forming with support near $40,880 on the hourly chart of the BTC/USD pair (data feed from Kraken).
- The pair could correct lower toward $40,800 before it starts a fresh increase.
Bitcoin Price Rises Over 10%
Bitcoin price started a strong increase above the $38,500 resistance zone. BTC gained over 10% in the past few sessions and broke many hurdles near $40,000.
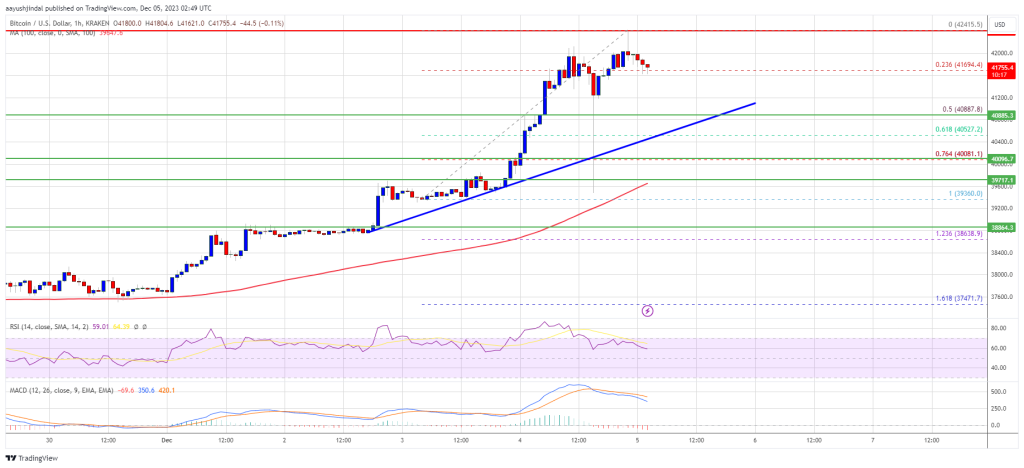
It even cleared the $41,200 resistance and spiked above the $42,000 zone. A new multi-month high is formed near $42,415 and the price is now correcting gains. There was a move below the $42,000 level. The price is now testing the 23.6% Fib retracement level of the upward move from the $39,360 swing low to the $42,415 high.
Bitcoin also trades above $41,200 and the 100 hourly Simple moving average. Besides, there is a major bullish trend line forming with support near $40,880 on the hourly chart of the BTC/USD pair. The trend line is close to the 50% Fib retracement level of the upward move from the $39,360 swing low to the $42,415 high.
On the upside, immediate resistance is near the $42,200 level. The first major resistance is forming near $42,500, above which the price might rise toward the $43,200 level.
Source: BTCUSD on TradingView.com
A close above the $43,200 resistance might send the price further higher. The next key resistance could be near $44,000, above which BTC could rise toward the $45,000 level.
Are Dips Limited In BTC?
If Bitcoin fails to rise above the $42,200 resistance zone, it could start a downside correction. Immediate support on the downside is near the $41,200 level.
The next major support is near $40,800 and the trend line. If there is a move below $40,800, there is a risk of more downsides. In the stated case, the price could drop toward the $40,000 support in the near term.
Technical indicators:
Hourly MACD – The MACD is now losing pace in the bullish zone.
Hourly RSI (Relative Strength Index) – The RSI for BTC/USD is now above the 50 level.
Major Support Levels – $41,200, followed by $40,800.
Major Resistance Levels – $42,200, $42,500, and $43,200.