

XRP price started a downside correction from the $0.750 zone. The price retested the $0.600 support zone and might soon attempt a fresh rally.
- XRP started a downside correction from the $0.750 resistance zone.
- The price is now trading below $0.650 and the 100 simple moving average (4 hours).
- There is a major bearish trend line forming with resistance near $0.6550 on the 4-hour chart of the XRP/USD pair (data source from Kraken).
- The pair might correct further lower, but the bulls could remain active near $0.600.
XRP Price Dips Below $0.650
After rallying above the $0.720 resistance, XRP faced resistance. The price struggled to clear the $0.750 barrier and recently started a downside correction, like Bitcoin and Ethereum.
The price declined below the $0.720 and $0.700 support levels. The bears even pushed it below the $0.650 pivot level. However, the bulls were active near the $0.600 zone. A low is formed near $0.5938 and the price is now attempting a fresh increase.
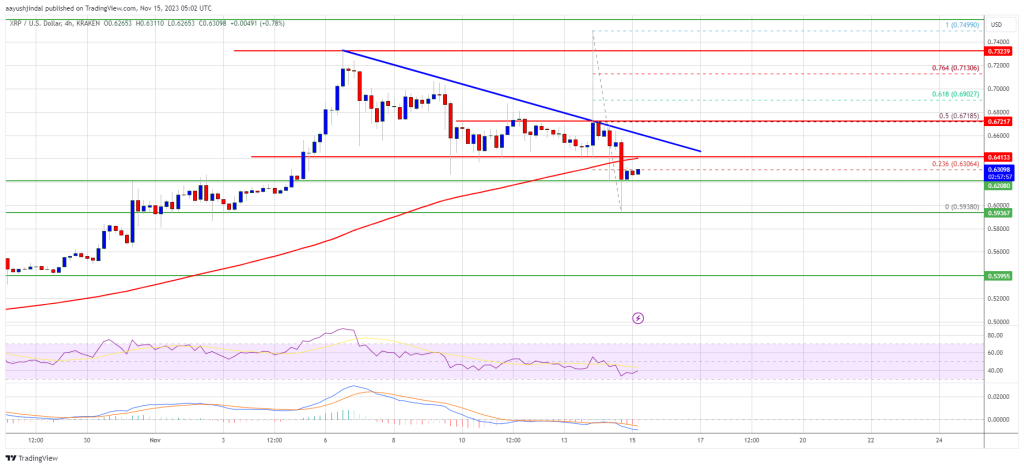
XRP is now trading below $0.650 and the 100 simple moving average (4 hours). There is also a major bearish trend line forming with resistance near $0.6550 on the 4-hour chart of the XRP/USD pair.
On the upside, immediate resistance is near the $0.630 level or the 23.6% Fib retracement level of the recent decline from the $0.7499 swing high to the $0.5938 low. The first major resistance is near the $0.640 zone or the trend line.
Source: XRPUSD on TradingView.com
A close above the trend line could send the price toward the $0.672 resistance. It is near the 50% Fib retracement level of the recent decline from the $0.7499 swing high to the $0.5938 low. If the bulls remain in action above the $0.672 resistance level, there could be a rally toward the $0.750 resistance. Any more gains might send XRP toward the $0.788 resistance.
Are Dips Limited?
If XRP fails to clear the $0.640 resistance zone, it could continue to move down. Initial support on the downside is near the $0.620 zone.
The next major support is at $0.600. If there is a downside break and a close below the $0.600 level, XRP price might accelerate lower. In the stated case, the price could retest the $0.540 support zone.
Technical Indicators
4-Hours MACD – The MACD for XRP/USD is now losing pace in the bullish zone.
4-Hours RSI (Relative Strength Index) – The RSI for XRP/USD is now below the 50 level.
Major Support Levels – $0.620, $0.600, and $0.540.
Major Resistance Levels – $0.630, $0.640, and $0.672.