

Ethereum price started a downside correction and traded below $2,000. ETH must stay above $1,920 to start a fresh increase in the near term.
- Ethereum is correcting gains and testing the $1,920 support zone.
- The price is trading below $2,000 and the 100-hourly Simple Moving Average.
- There is a key bearish trend line forming with resistance near $2,000 on the hourly chart of ETH/USD (data feed via Kraken).
- The pair could start a fresh increase if it clears the $2,000 resistance zone in the near term.
Ethereum Price Holds Key Support
After struggling to clear the $2,120 resistance, Ethereum price started a downside correction like Bitcoin. ETH traded below the $2,050 and $2,000 support levels.
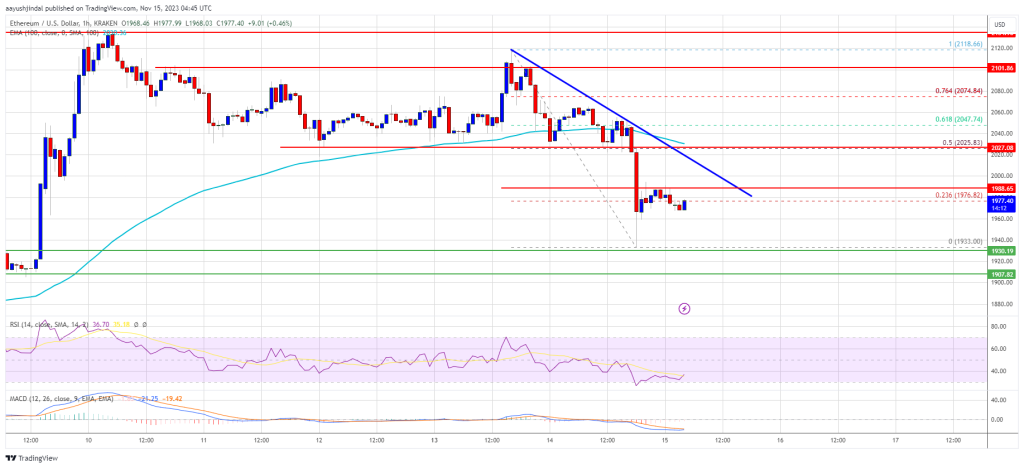
However, the bulls were active above the $1,920 support zone. A low was formed near $1,933 and the price is now consolidating losses. It is trading near the 23.6% Fib retracement level of the recent drop from the $2,118 swing high to the $1,933 low.
Ethereum is now trading below $2,000 and the 100-hourly Simple Moving Average. Immediate resistance is near the $2,000 zone. There is also a key bearish trend line forming with resistance near $2,000 on the hourly chart of ETH/USD.
The next major resistance sits at $2,025 or the 100-hourly Simple Moving Average or the 50% Fib retracement level of the recent drop from the $2,118 swing high to the $1,933 low. A close above the trend line and $2,025 could start a decent increase.
Source: ETHUSD on TradingView.com
The next key resistance is near $2,075, above which the price could aim for a move toward the $2,120 barrier. Any more gains could start a wave toward the $2,250 level.
More Losses in ETH?
If Ethereum fails to clear the $2,000 resistance and the trend line, it could start a fresh decline. Initial support on the downside is near the $1,950 level.
The next key support is $1,920. A downside break below the $1,920 support might start a sharp decline. In the stated case, Ether could drop toward the $1,850 support zone in the near term. Any more losses might call for a drop toward the $1,800 level.
Technical Indicators
Hourly MACD – The MACD for ETH/USD is losing momentum in the bearish zone.
Hourly RSI – The RSI for ETH/USD is now below the 50 level.
Major Support Level – $1,920
Major Resistance Level – $2,025