

Cardano (ADA) is gaining pace above the $0.350 resistance. ADA is showing heavy bullish signs and might rally toward $0.400 or even $0.420.
- ADA price outperformed Bitcoin and rallied above the $0.350 resistance.
- The price is trading above $0.350 and the 100 simple moving average (4 hours).
- There is a key bullish trend line forming with support near $0.3505 on the 4-hour chart of the ADA/USD pair (data source from Kraken).
- The pair could accelerate higher toward the $0.400 level or even $0.420.
Cardano Price Rally Seems Far From Over
In the past few days, Cardano saw a decent increase from the $0.2850 support. It is up over 20% and broke many hurdles near the $0.350 resistance zone, outperforming Bitcoin and Ethereum.
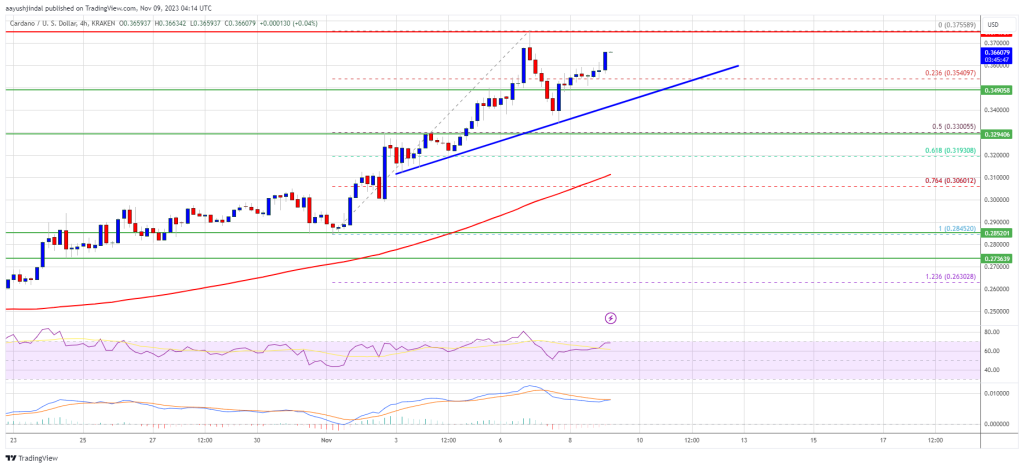
The upward move was such that the price spiked toward $0.3750. A high was formed near $0.3755 before there was a downside correction. The price declined below the $0.3550 support. It spiked below the 23.6% Fib retracement level of the upward move from the $0.2845 swing low to the $0.3755 high.
However, the bulls were active above the $0.3400 zone. There is also a key bullish trend line forming with support near $0.3505 on the 4-hour chart of the ADA/USD pair.
Source: ADAUSD on TradingView.com
ADA is now trading above $0.350 and the 100 simple moving average (4 hours). On the upside, immediate resistance is near the $0.3750 zone. The first resistance is near $0.380. The next key resistance might be $0.400. If there is a close above the $0.400 resistance, the price could extend its rally. In the stated case, the price could rise toward the $0.420 region.
Are Dips Limited in ADA?
If Cardano’s price fails to climb above the $0.3750 resistance level, it could start a downside correction. Immediate support on the downside is near the $0.3550 level.
The next major support is near the $0.350 level and the trend line. A downside break below the $0.350 level could open the doors for a test of the 50% Fib retracement level of the upward move from the $0.2845 swing low to the $0.3755 high at $0.3300. The next major support is near the $0.3080 level.
Technical Indicators
4 hours MACD – The MACD for ADA/USD is gaining momentum in the bullish zone.
4 hours RSI (Relative Strength Index) – The RSI for ADA/USD is now above the 50 level.
Major Support Levels – $0.355, $0.350, and $0.330.
Major Resistance Levels – $0.375, $0.400, and $0.420.