

Bitcoin Cash price is holding the key $205 support against the US Dollar. BCH could start a fresh increase if it stays above the $205 and $200 support levels.
- Bitcoin cash price started a fresh decline below the $230 level against the US Dollar.
- The price is trading below $220 and the 100 simple moving average (4 hours).
- There is a key bearish trend line forming with resistance near $217 on the 4-hour chart of the BCH/USD pair (data feed from Kraken).
- The pair could start a fresh increase unless there is a move below $200.
Bitcoin Cash Price Holds Support
In the past few days, Bitcoin Cash price saw a steady decline from the $255 resistance zone. BCH declined below the $232 support to enter a short-term bearish zone, like Bitcoin and Ethereum.
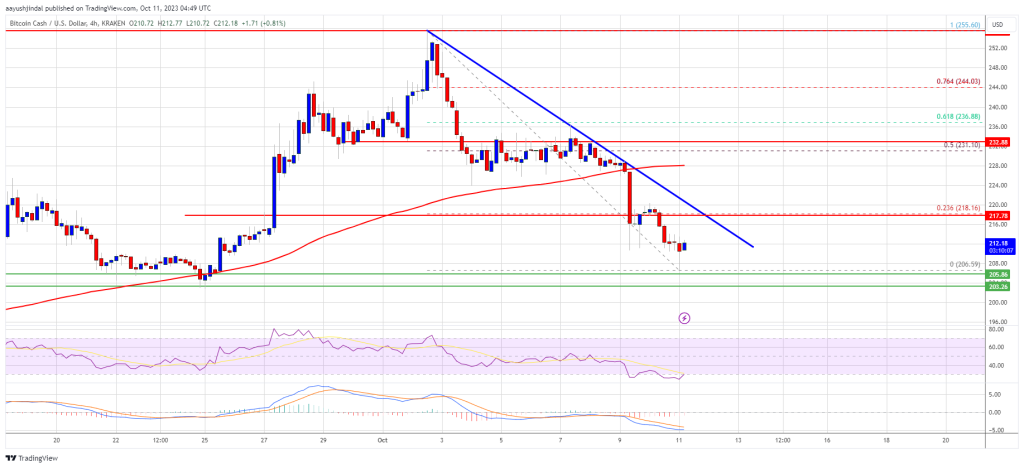
The bears were able to push the price below the $220 support. Finally, the price found support near the $205 zone (a multi-touch zone). A low has formed near $206.59 and the price is now consolidating losses. It seems like there is a key bearish trend line forming with resistance near $217 on the 4-hour chart of the BCH/USD pair.
Bitcoin Cash is now trading below $220 and the 100 simple moving average (4 hours). Immediate resistance is near the $217 level and the trend line. It is close to the 23.6% Fib retracement level of the downward move from the $255 swing high to the $206 low.
Source: BCH/USD on TradingView.com
The next major resistance is near $228 or the 100 simple moving average (4 hours). The next major resistance is near the $232 level. It is close to the 50% Fib retracement level of the downward move from the $255 swing high to the $206 low. Any further gains could lead the price toward the $250 resistance zone.
Downside Break in BCH?
If Bitcoin Cash price fails to clear the $217 resistance, it could continue to move down. Initial support on the downside is near the $205 level.
The next major support is near the $200 level, where the bulls are likely to appear. If the price fails to stay above the $200 support, the price could test the $184 support. Any further losses could lead the price toward the $162 zone in the near term.
Technical indicators
4-hour MACD – The MACD for BCH/USD is losing pace in the bearish zone.
4-hour RSI (Relative Strength Index) – The RSI is currently below the 50 level.
Key Support Levels – $205 and $200.
Key Resistance Levels – $217 and $232.