

Ethereum price is struggling to stay above the $1,550 support against the US dollar. ETH could take a hit if it settles below $1,550 and then $1,540.
- Ethereum is showing bearish signs and struggling to clear the $1,600.
- The price is trading below $1,600 and the 100-hourly Simple Moving Average.
- There is a major bearish trend line forming with resistance near $1,600 on the hourly chart of ETH/USD (data feed via Kraken).
- The pair could start a recovery wave if the bulls defend the $1,550 support zone.
Ethereum Price Struggles
Ethereum failed to start a recovery wave above the $1,600 resistance zone. ETH remained in a bearish zone and extended its decline toward $1,550, like Bitcoin.
It seems like the bears already attempted a close below the $1,550 support zone. A new swing low was formed near $1,542 and the price is now consolidating losses. The price is back above the $1,550 level, but it is still showing heavy bearish signs.
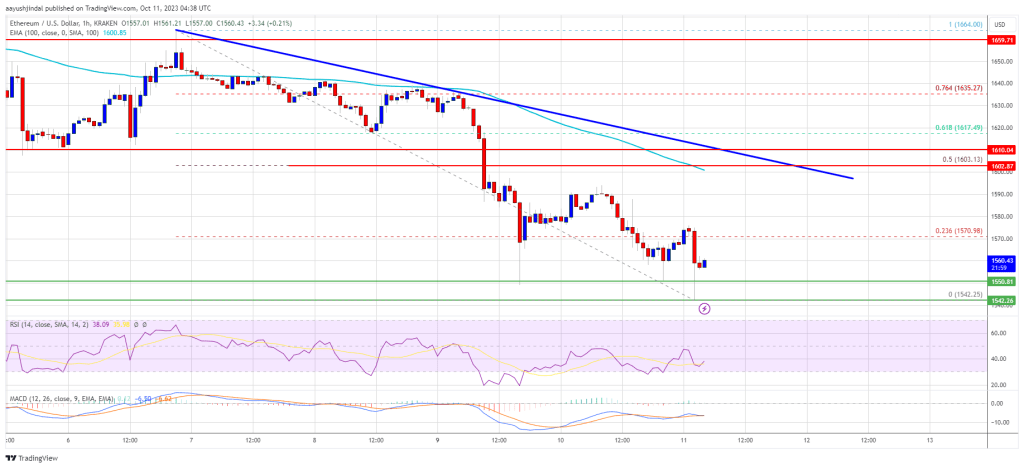
Ethereum is now trading below $1,600 and the 100-hourly Simple Moving Average. Besides, there is a major bearish trend line forming with resistance near $1,600 on the hourly chart of ETH/USD.
On the upside, the price might face resistance near the $1,570 level. It is near the 23.6% Fib retracement level of the downward move from the $1,664 swing high to the $1,542 low. The first major resistance is near the trend line and $1,600 or the 100-hourly Simple Moving Average.
Source: ETHUSD on TradingView.com
The 50% Fib retracement level of the downward move from the $1,664 swing high to the $1,542 low is also near the trend line. The next major resistance is $1,620, above which the price could rise toward the $1,665 resistance zone. A close above the $1,665 resistance might send the price toward the main resistance at $1,750. Any more gains might open the doors for a move toward $1,880.
Downside Break in ETH?
If Ethereum fails to clear the $1,600 resistance, it could continue to move down. Initial support on the downside is near the $1,550 level. The next key support is $1,540.
A downside break below the $1,540 support might start another strong decline. In the stated case, the price could revisit the $1,480 level. Any more losses may perhaps send Ether toward the $1,420 level.
Technical Indicators
Hourly MACD – The MACD for ETH/USD is losing momentum in the bearish zone.
Hourly RSI – The RSI for ETH/USD is now below the 50 level.
Major Support Level – $1,540
Major Resistance Level – $1,600