

Ripple is struggling to recover above the $0.48 resistance against the US Dollar. XRP price could extend losses if there is a close below the $0.44 support.
- Ripple started a fresh decline from the $0.500 zone against the US dollar.
- The price is now trading below $0.488 and the 100 simple moving average (4 hours).
- There is a key bearish trend line forming with resistance near $0.470 on the 4-hour chart of the XRP/USD pair (data source from Kraken).
- The pair might decline further if it stays below the $0.488 and $0.500 resistance levels.
Ripple Price Faces Hurdles
After a minor upward move, Ripple’s XRP struggled to gain pace for a move above the $0.50 resistance against the US Dollar. A high is formed near $0.4868 and the price is moving lower, similar to Bitcoin and Ethereum.
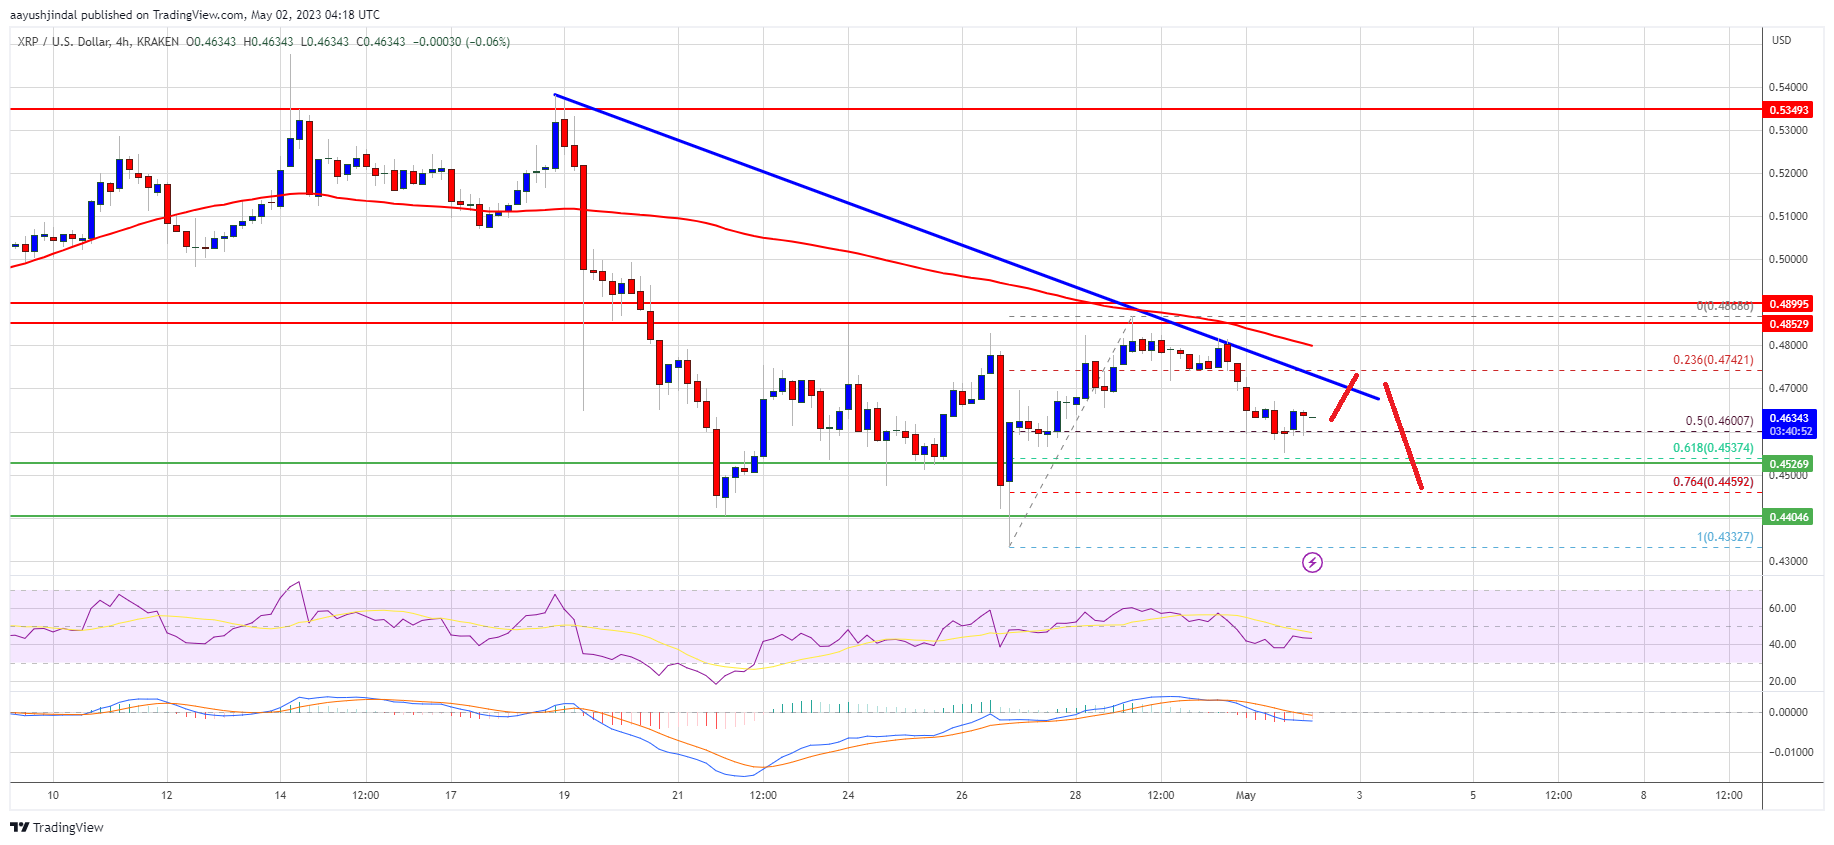
There was a clear move below the $0.475 and $0.470 support levels. The price is now trading near the 50% Fib retracement level of the upward move from the $0.4332 swing low to the $0.4868 high. It is now trading below $0.488 and the 100 simple moving average (4 hours).
Initial resistance is near the $0.470 zone. There is also a key bearish trend line forming with resistance near $0.470 on the 4-hour chart of the XRP/USD pair.
Source: XRPUSD on TradingView.com
The first major resistance is near the $0.480 level or the 100 simple moving average (4 hours). The main resistance is near the $0.488 level. A successful break above the $0.480 and $0.488 resistance levels might send the price toward the $0.520 resistance. Any more gains might send the price toward the $0.535 resistance.
More Losses in XRP?
If ripple fails to clear the $0.480 resistance zone, it could continue to move down. Initial support on the downside is near the $0.454 zone or the 61.8% Fib retracement level of the upward move from the $0.4332 swing low to the $0.4868 high.
The next major support is near $0.440. If there is a downside break and a close below the $0.440 level, XRP’s price could extend losses. In the stated case, the price could test the $0.400 support zone.
Technical Indicators
4-Hours MACD – The MACD for XRP/USD is now gaining pace in the bearish zone.
4-Hours RSI (Relative Strength Index) – The RSI for XRP/USD is now below the 50 level.
Major Support Levels – $0.454, $0.440, and $0.400.
Major Resistance Levels – $0.480, $0.488, and $0.500.