

BNB price (Binance coin) faced a major resistance near $345 against the US Dollar. It is now testing key support at $325, below which it might dive to $315.
- Binance coin price is slowly moving lower from the $345 resistance against the US Dollar.
- The price is now trading below $330 and the 100 simple moving average (4 hours).
- There is a key bullish trend line forming with support near $325 on the 4-hour chart of the BNB/USD pair (data source from Binance).
- The pair could start a fresh increase if it stays above $325.
Binance Coin Price Holds Support
This past week, BNB price saw a decent increase above the $325 level, similar to Bitcoin and Ethereum. The bulls were able to push the price above the $335 and $340 levels.
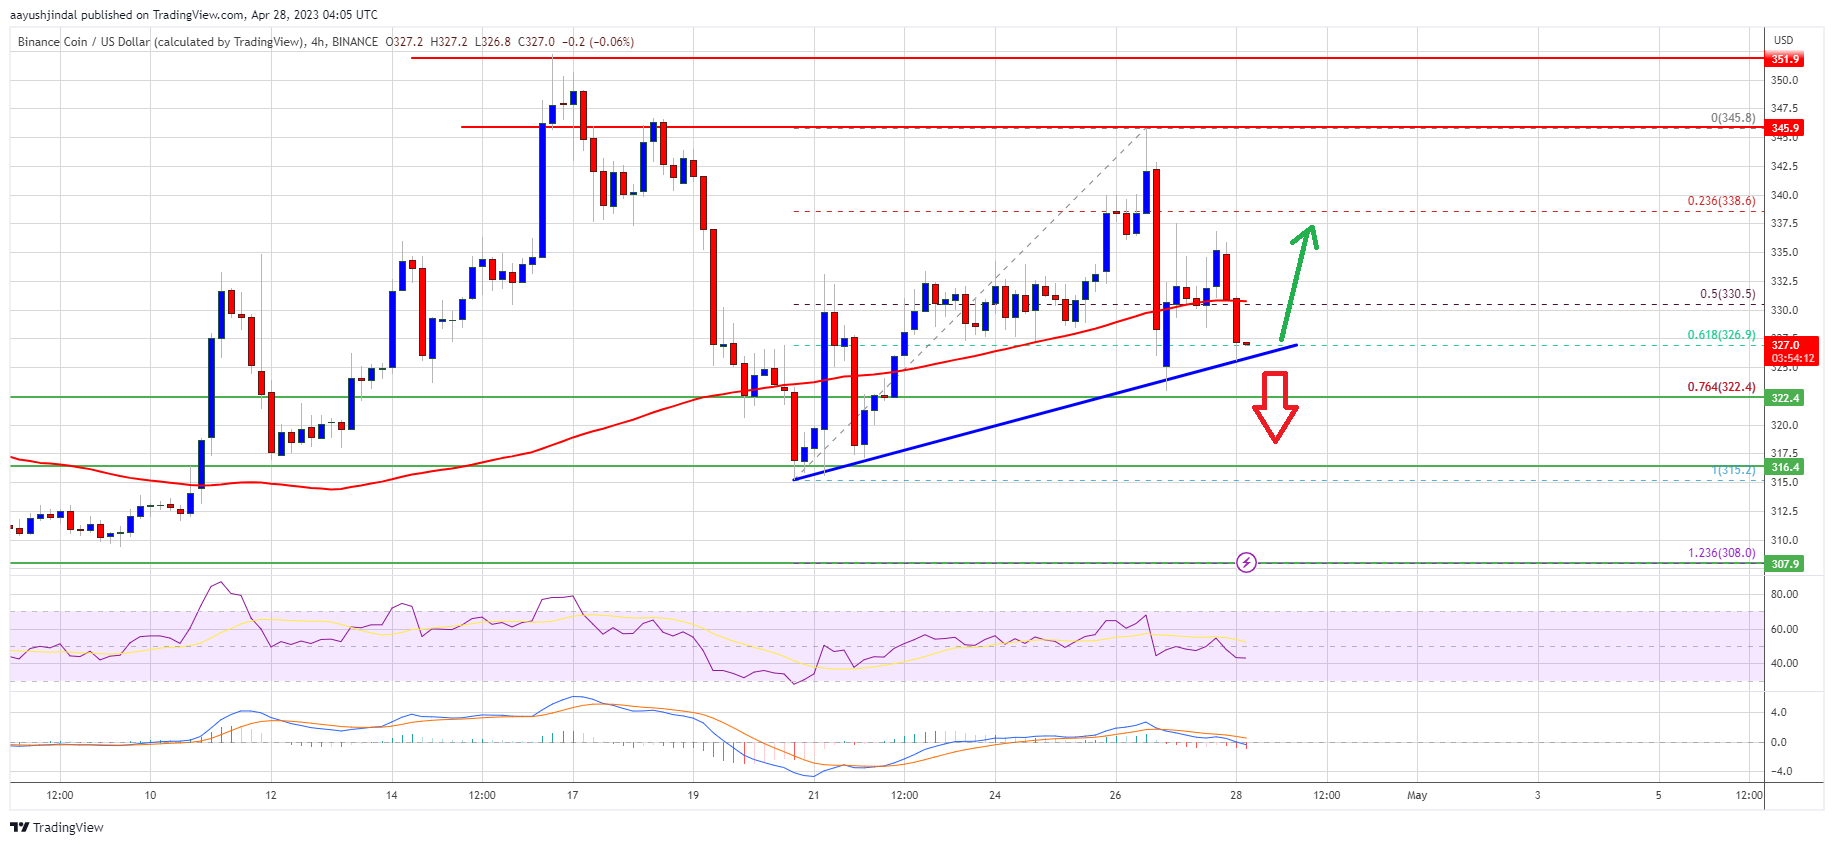
However, the price faced strong resistance near the $345 level. A high was formed near $345 and the price started a steady decline. There was a move below the $340 and $335 support levels. The bears pushed the price below the 50% Fib retracement level of the upward move from the $315 swing low to the $345 high.
It is now trading below $330 and the 100 simple moving average (4 hours). Besides, there is a key bullish trend line forming with support near $325 on the 4-hour chart of the BNB/USD pair.
Source: BNBUSD on TradingView.com
On the upside, BNB is facing resistance near the $330 level and the 100 simple moving average (4 hours). The next major resistance is near the $335 level. A clear move above the $335 resistance might spark bullish moves. The next major resistance is near the $345 level, above which the price might rise toward the $350 resistance. Any more gains might send the price toward the $365 level.
More Losses in BNB?
If BNB fails to clear the $330 resistance, it could continue to move down. Initial support on the downside is near the $325 level or the trend line.
The next major support is near the $322 level. If there is a downside break below the $322 support, there could be an extended decline toward the $315 support.
Technical Indicators
4-Hours MACD – The MACD for BNB/USD is gaining pace in the bearish zone.
4-Hours RSI (Relative Strength Index) – The RSI for BNB/USD is currently below the 50 level.
Major Support Levels – $325, $322, and $315.
Major Resistance Levels – $330, $335, and $345.