

Bitcoin price is attempting an upside break above $16,800. BTC could start a decent increase if it clears the $16,800 and $17,000 resistance levels.
- Bitcoin is still facing a strong resistance near $17,000 and $17,200.
- The price is trading above $16,700 and the 100 hourly simple moving average.
- There is a key bearish trend line forming with resistance near $16,800 on the hourly chart of the BTC/USD pair (data feed from Kraken).
- The pair could attempt a fresh increase if there is a clear move above the $17,000 resistance zone.
Bitcoin Price Eyes Recovery
Bitcoin price remained stable above the $16,500 zone. BTC attempted an upside break above the $17,000 resistance, but it faced sellers.
A high was formed near $17,067 and the price started a downside correction. There was a move below the $16,800 level and the 100 hourly simple moving average. The price declined below the 50% Fib retracement level of the up move from the $16,260 swing low to $17,067 high.
Bitcoin price tested the $16,550 level, where it found support. It remained stable above the 61.8% Fib retracement level of the up move from the $16,260 swing low to $17,067 high.
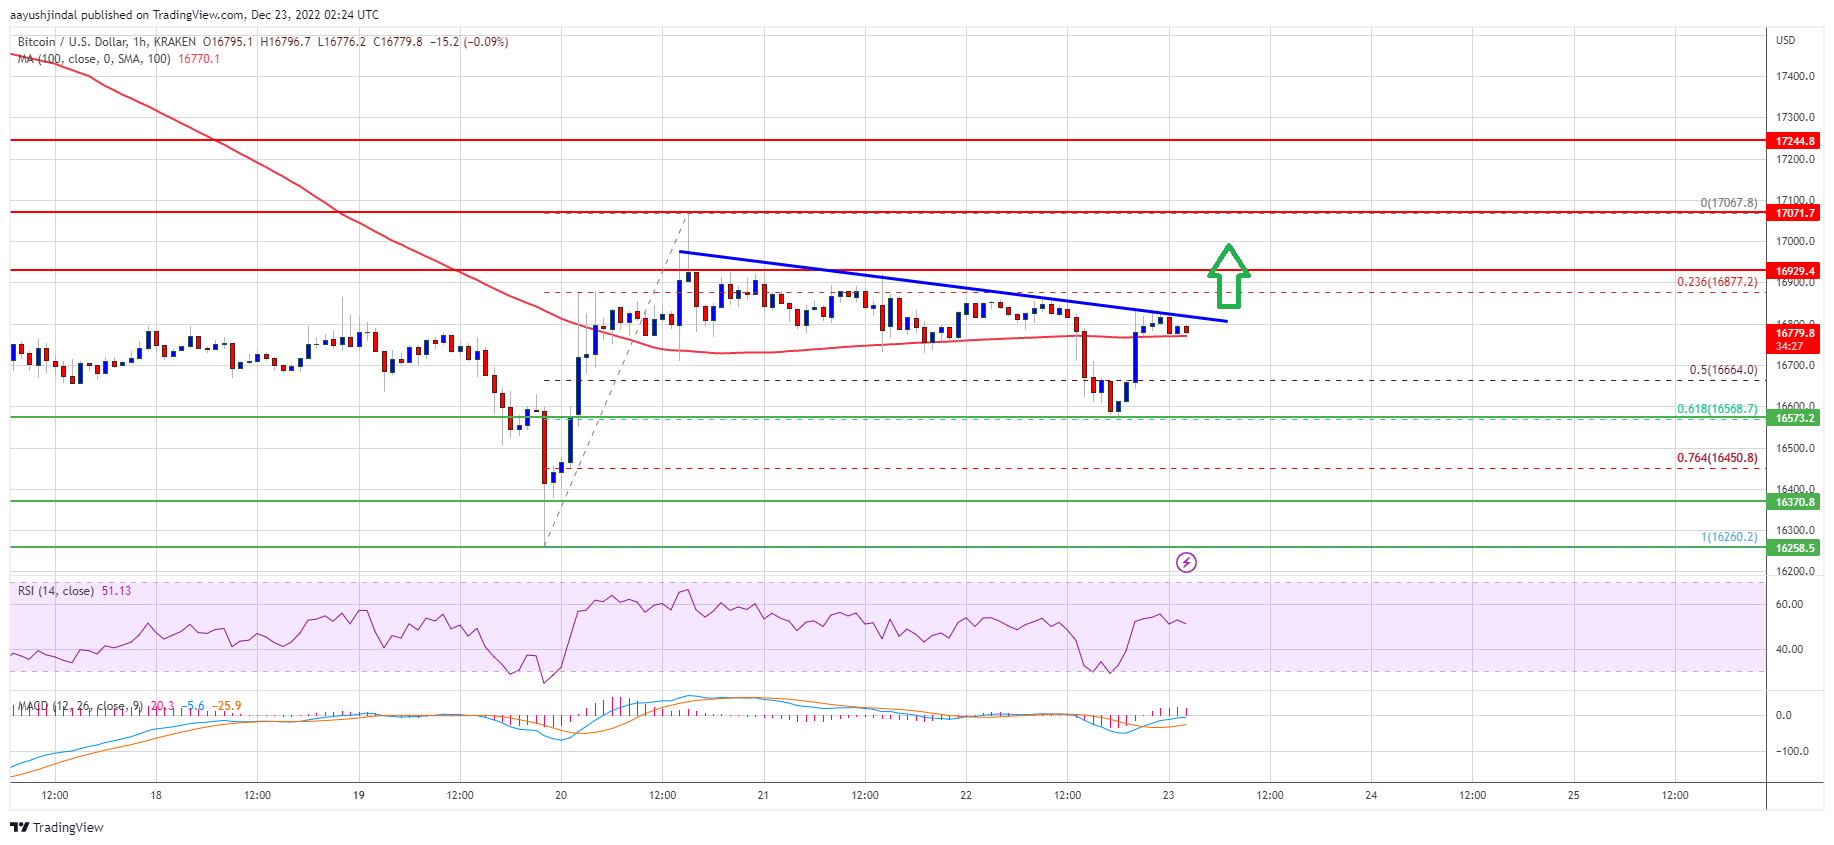
The price recovered losses and climbed above $16,700. It is now trading above $16,700 and the 100 hourly simple moving average. On the upside, an immediate resistance is near the $16,800 zone. There is also a key bearish trend line forming with resistance near $16,800 on the hourly chart of the BTC/USD pair.
Source: BTCUSD on TradingView.com
The first major resistance is near the $17,000 zone. A clear move above the $17,000 resistance might encourage the bulls to pump the price above the $17,200 resistance. If they succeed, the price could even surpass the $17,500 level. The next major resistance is near $18,000, above which the price climb towards the $18,500 resistance zone.
Fresh Drop in BTC?
If bitcoin fails to clear the $17,000 resistance, there could be a fresh drop. An immediate support on the downside is near the $16,750 level and the 100 hourly SMA
The next major support is near the $16,550 level. A downside break below the $16,550 support might call for a move towards the $16,350 level. Any more losses might send the price towards $16,000.
Technical indicators:
Hourly MACD – The MACD is now gaining pace in the bullish zone.
Hourly RSI (Relative Strength Index) – The RSI for BTC/USD is now above the 50 level.
Major Support Levels – $16,700, followed by $16,550.
Major Resistance Levels – $16,800, $17,000 and $17,500.