

Ripple is consolidating above the $0.375 support zone against the US Dollar. XRP price could gain pace if it clears the $0.40 and $0.415 resistance levels.
- Ripple is currently consolidating above the $0.375 and $0.380 levels against the US dollar.
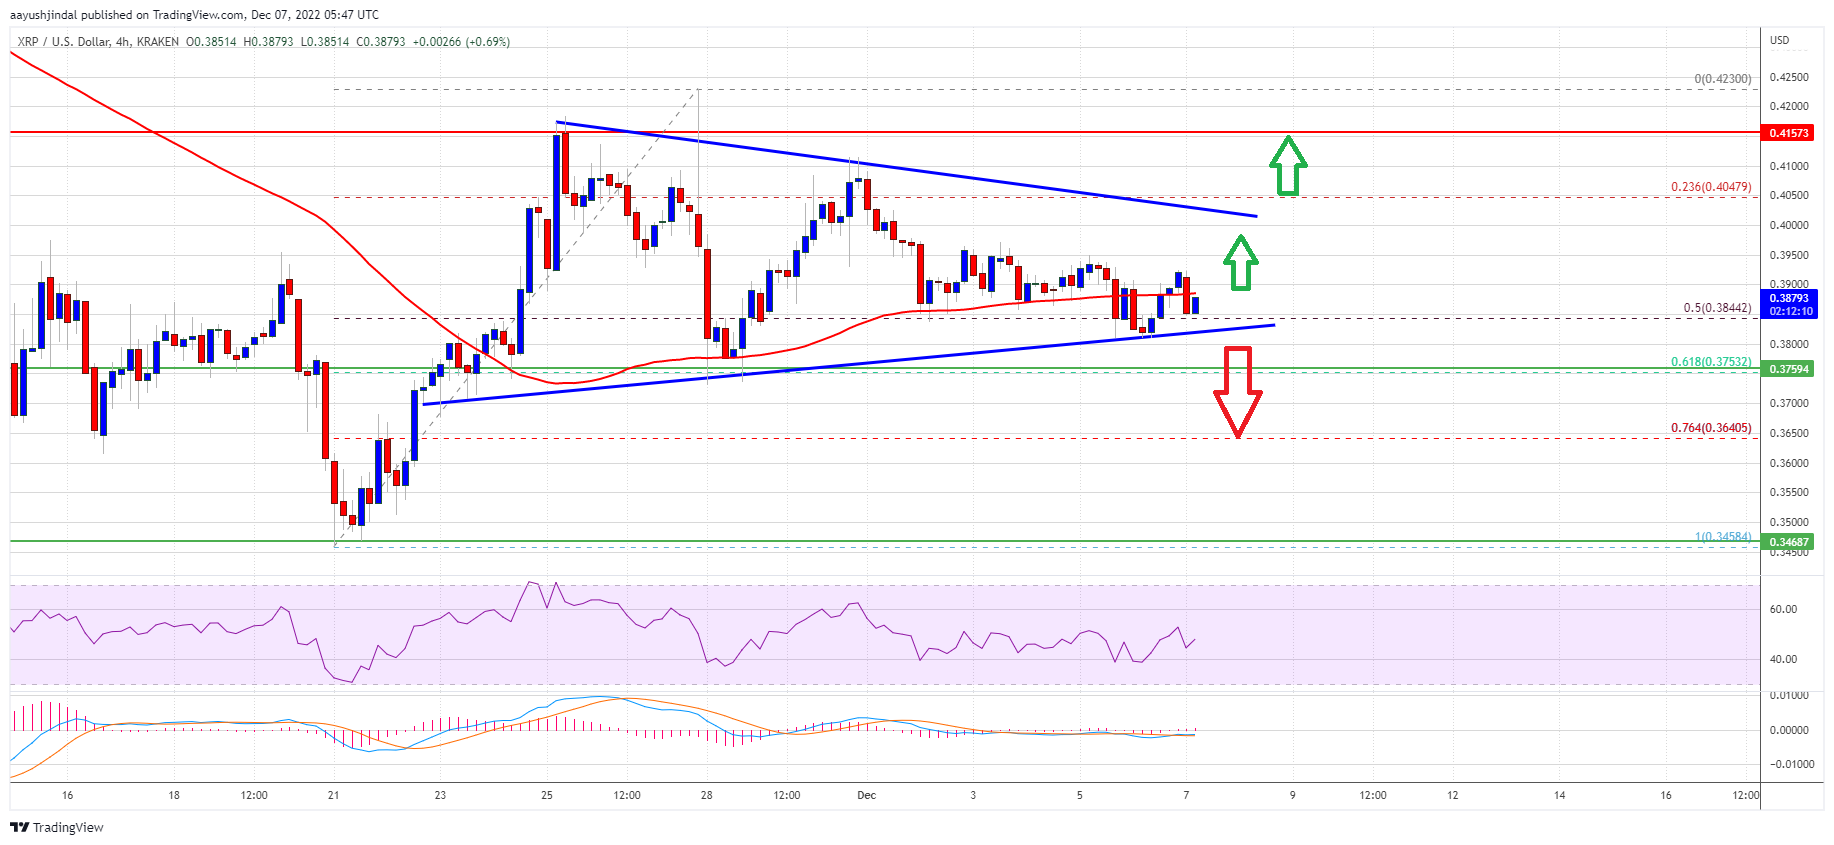
- The price is now trading near $0.388 and the 100 simple moving average (4-hours).
- There is a key contracting triangle forming with support near $0.382 on the 4-hours chart of the XRP/USD pair (data source from Kraken).
- The pair could start a strong increase if it clears the $0.400 resistance zone.
Ripple Price Remains Supported
After forming a base above the $0.345 level, ripple’s XRP started a decent increase against the US Dollar. The price was able to surpass the $0.375 and $0.380 resistance levels.
The price even spiked above the $0.40 level and settled above the 100 simple moving average (4-hours). However, the bears were active near the $0.423 zone. A high was formed near $0.423 before there was a downside correction, just like bitcoin.
Xrp price declined below the $0.40 support and the 100 simple moving average (4-hours). There was a clear move below the 50% Fib retracement level of the upward move from the $0.3458 swing low to $0.423 high.
The bulls are now active near the $0.375 level. There is also a key contracting triangle forming with support near $0.382 on the 4-hours chart of the XRP/USD pair. The price is currently consolidating above the $0.375 and $0.380 levels.
Source: XRPUSD on TradingView.com
An immediate resistance is near the $0.400 zone. A successful break above the $0.400 resistance might send the price towards the $0.425 resistance. The next key resistance is near the $0.450 level. Any more gains might send the price towards the $0.50 level in the coming days.
Downside Break in XRP?
If ripple fails to clear the $0.400 resistance zone, it could start a downside correction. An initial support on the downside is near the $0.382 level and the contracting trend line.
The next major support is near $0.375. If there is a downside break and close below the $0.375 level, xrp price could extend losses. In the stated case, the price could even decline below the $0.345 support.
Technical Indicators
4-Hours MACD – The MACD for XRP/USD is now losing pace in the bearish zone.
4-Hours RSI (Relative Strength Index) – The RSI for XRP/USD is now near the 50 level.
Major Support Levels – $0.382, $0.375 and $0.345.
Major Resistance Levels – $0.400, $0.425 and $0.450.