

Bitcoin price extended its increase and tested the $17,500 resistance. BTC corrected gains, but it remains well supported above the $16,800 support.
- Bitcoin extended its upward move above $17,100 and $17,300 resistance levels.
- The price is trading near $17,000 and the 100 hourly simple moving average.
- There was a break below a key bullish trend line with support near $17,050 on the hourly chart of the BTC/USD pair (data feed from Kraken).
- The pair must stay above the $16,800 support to start a fresh increase.
Bitcoin Price Remains Supported
Bitcoin price settled above the $17,000 resistance zone and extended its increase. BTC was able to clear the $17,100 and $17,200 resistance levels.
The price even spiked above $17,400 and traded close to the $17,500 resistance zone. However, the bears were active near the $17,500 resistance zone. A high was formed near $17,440 and the price started a downside correction.
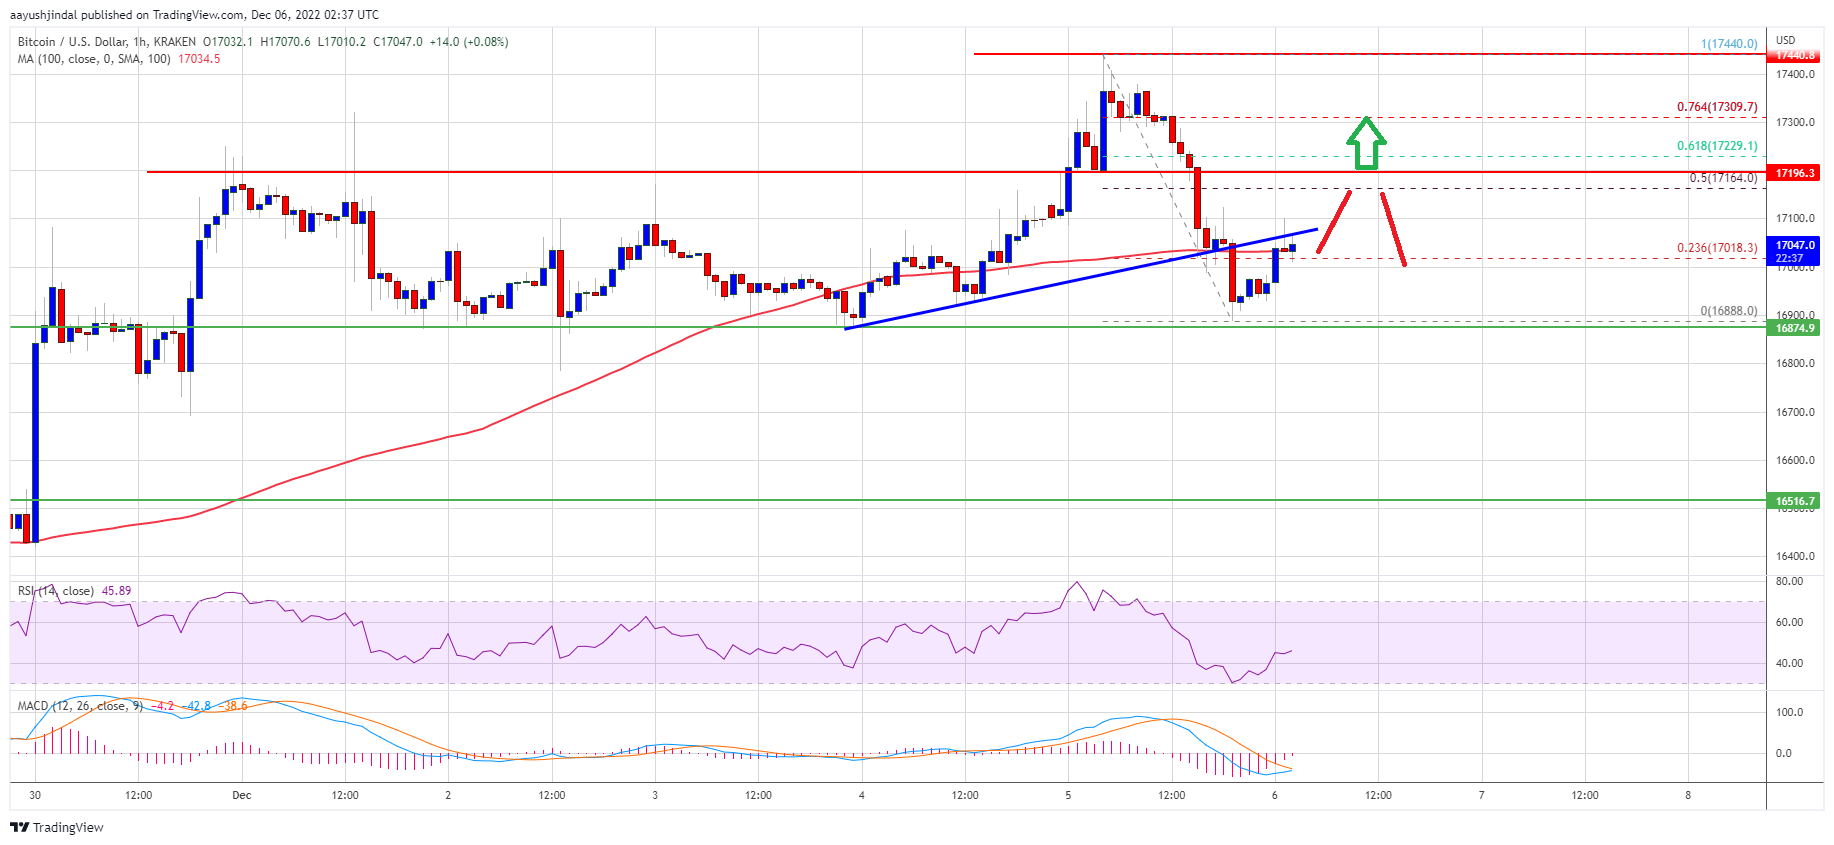
Bitcoin price declined below the $17,200 level and the 100 hourly simple moving average. There was a break below a key bullish trend line with support near $17,050 on the hourly chart of the BTC/USD pair.
The price traded as low as $16,888 and is currently rising. It is trading near $17,000 and the 100 hourly simple moving average. It is trading above the 23.6% Fib retracement level of the recent decline from the $17,440 swing high to $16,888 low.
On the upside, an immediate resistance is near the $17,165 level. It is near the 50% Fib retracement level of the recent decline from the $17,440 swing high to $16,888 low. The first major resistance is near the $17,250 zone, above which the price may perhaps start another steady increase.
Source: BTCUSD on TradingView.com
In the stated case, the price could rise towards the $17,500 resistance. The next major resistance is near $17,650, above which the price rise towards the $18,000 zone in the near term.
More Losses in BTC?
If bitcoin fails to start a fresh increase above the $17,165 resistance, there could be more downsides. An immediate support on the downside is near the $16,850 level.
The next major support is near the $16,800 zone. A downside break below the $16,800 support might call for a move towards $16,500. Any more losses might call for a test of the key $16,000 support zone in the near term.
Technical indicators:
Hourly MACD – The MACD is now losing pace in the bearish zone.
Hourly RSI (Relative Strength Index) – The RSI for BTC/USD is now just below the 50 level.
Major Support Levels – $16,800, followed by $16,500.
Major Resistance Levels – $17,165, $17,250 and $18,000.