

Ethereum failed to clear the $1,300 resistance zone against the US Dollar. ETH remains at a risk of more losses if there is a break below the $1,170 support zone.
- Ethereum is facing resistance near the $1,250 and $1,280 levels.
- The price is now trading below $1,240 and the 100 hourly simple moving average.
- There is a major bearish trend line forming with resistance near $1,245 on the hourly chart of ETH/USD (data feed via Kraken).
- The pair could accelerate lower if there is a clear move below $1,180 and $1,170.
Ethereum Price Faces Hurdles
Ethereum attempted an upside break above the $1,300 resistance, similar to bitcoin at $17,000. ETH failed to gain pace for a clear move above the $1,300 resistance.
A high was formed near $1,290 before the price started a fresh decline. There was a clear move below the $1,260 and $1,250 levels. Ether price even traded below the $1,220 level. A low is formed near $1,183 and the price is now consolidating losses.
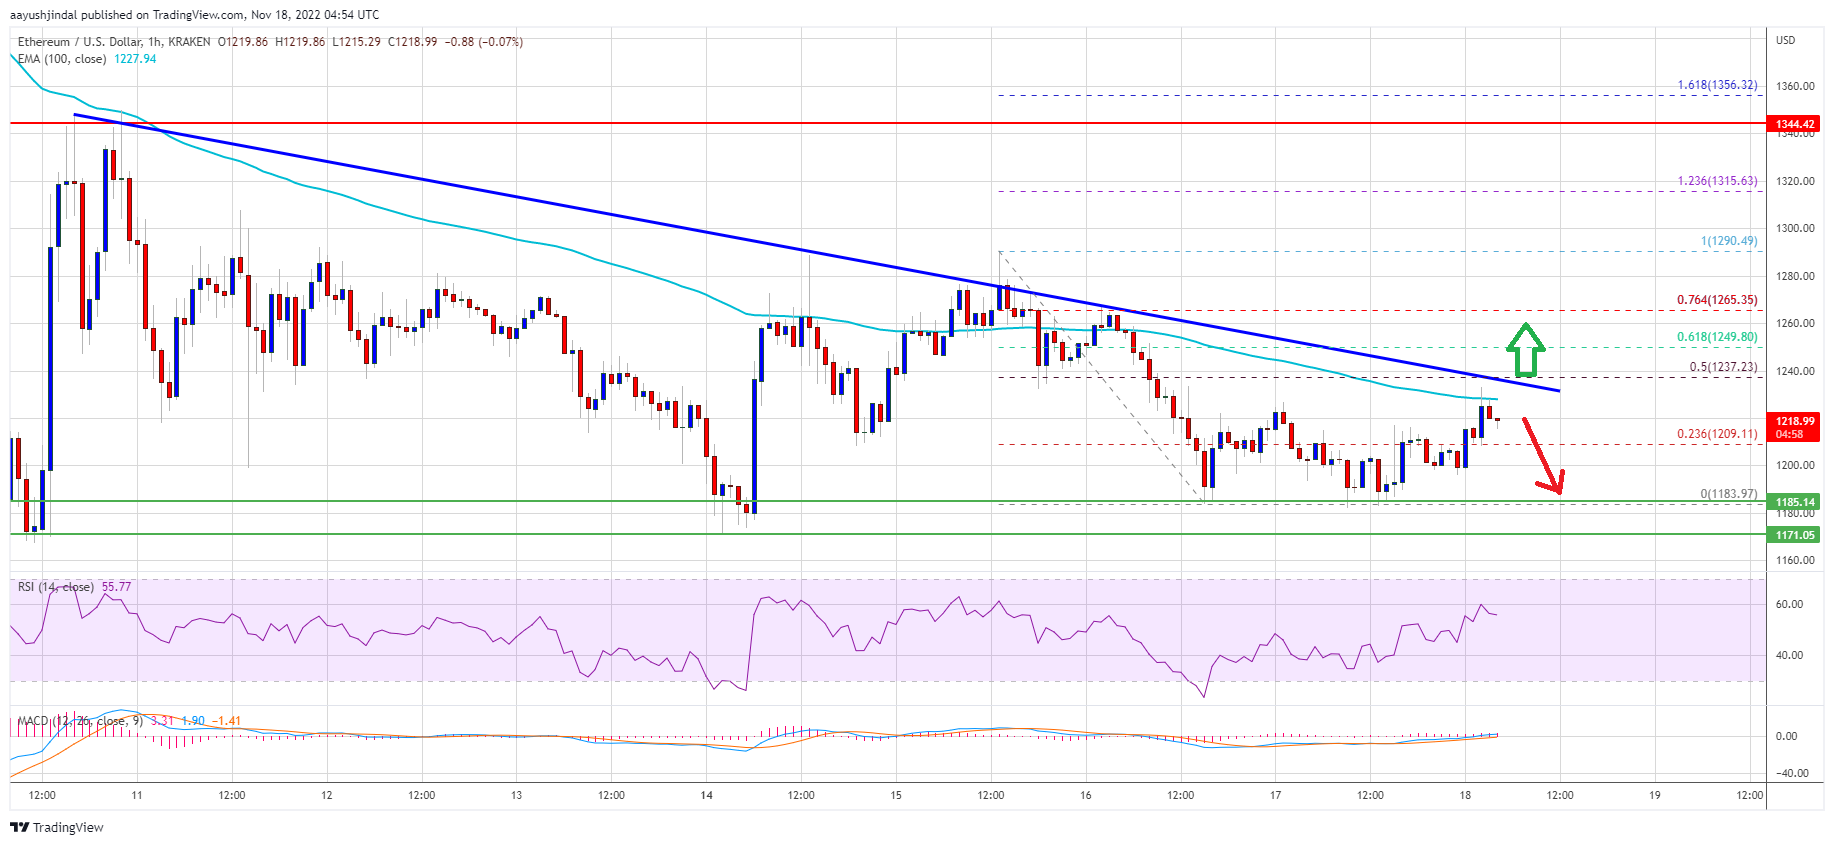
The price is now trading below $1,240 and the 100 hourly simple moving average. There was a minor increase above the 23.6% Fib retracement level of the recent decline from the $1,290 swing high to $1,183 low.
An immediate resistance on the upside is near the $1,240 level. There is also a major bearish trend line forming with resistance near $1,245 on the hourly chart of ETH/USD. The trend line is near the 50% Fib retracement level of the recent decline from the $1,290 swing high to $1,183 low.
Source: ETHUSD on TradingView.com
The next major resistance is near the $1,265 level. A clear break above the $1,265 resistance could send the price towards the $1,300 resistance zone. To start a steady increase, the price must settle above $1,300. In the stated case, the price could rise towards the $1,400 level.
More Losses in ETH?
If ethereum fails to climb above the $1,245 resistance, it could continue to move down. An initial support on the downside is near the $1,185 level.
The next major support is near the $1,170 level, below which ether price may perhaps start another major decline. In the stated scenario, the price could drop towards the $1,100 support zone in the near term.
Technical Indicators
Hourly MACD – The MACD for ETH/USD is now losing momentum in the bearish zone.
Hourly RSI – The RSI for ETH/USD is now below the 50 level.
Major Support Level – $1,170
Major Resistance Level – $1,265