

Ripple is facing resistance near $0.46 against the US Dollar. XRP price could start a fresh rally if it is able to clear the $0.46 and $0.478 resistance levels.
- Ripple is consolidating above the key $0.442 support zone against the US dollar.
- The price is facing hurdles near $0.460 and the 100 simple moving average (4-hours).
- There is a crucial bearish trend line forming with resistance near $0.4605 on the 4-hours chart of the XRP/USD pair (data source from Kraken).
- The pair could start a strong increase if there is a clear move above $0.462 and $0.482.
Ripple Price Prepares For The Next Move
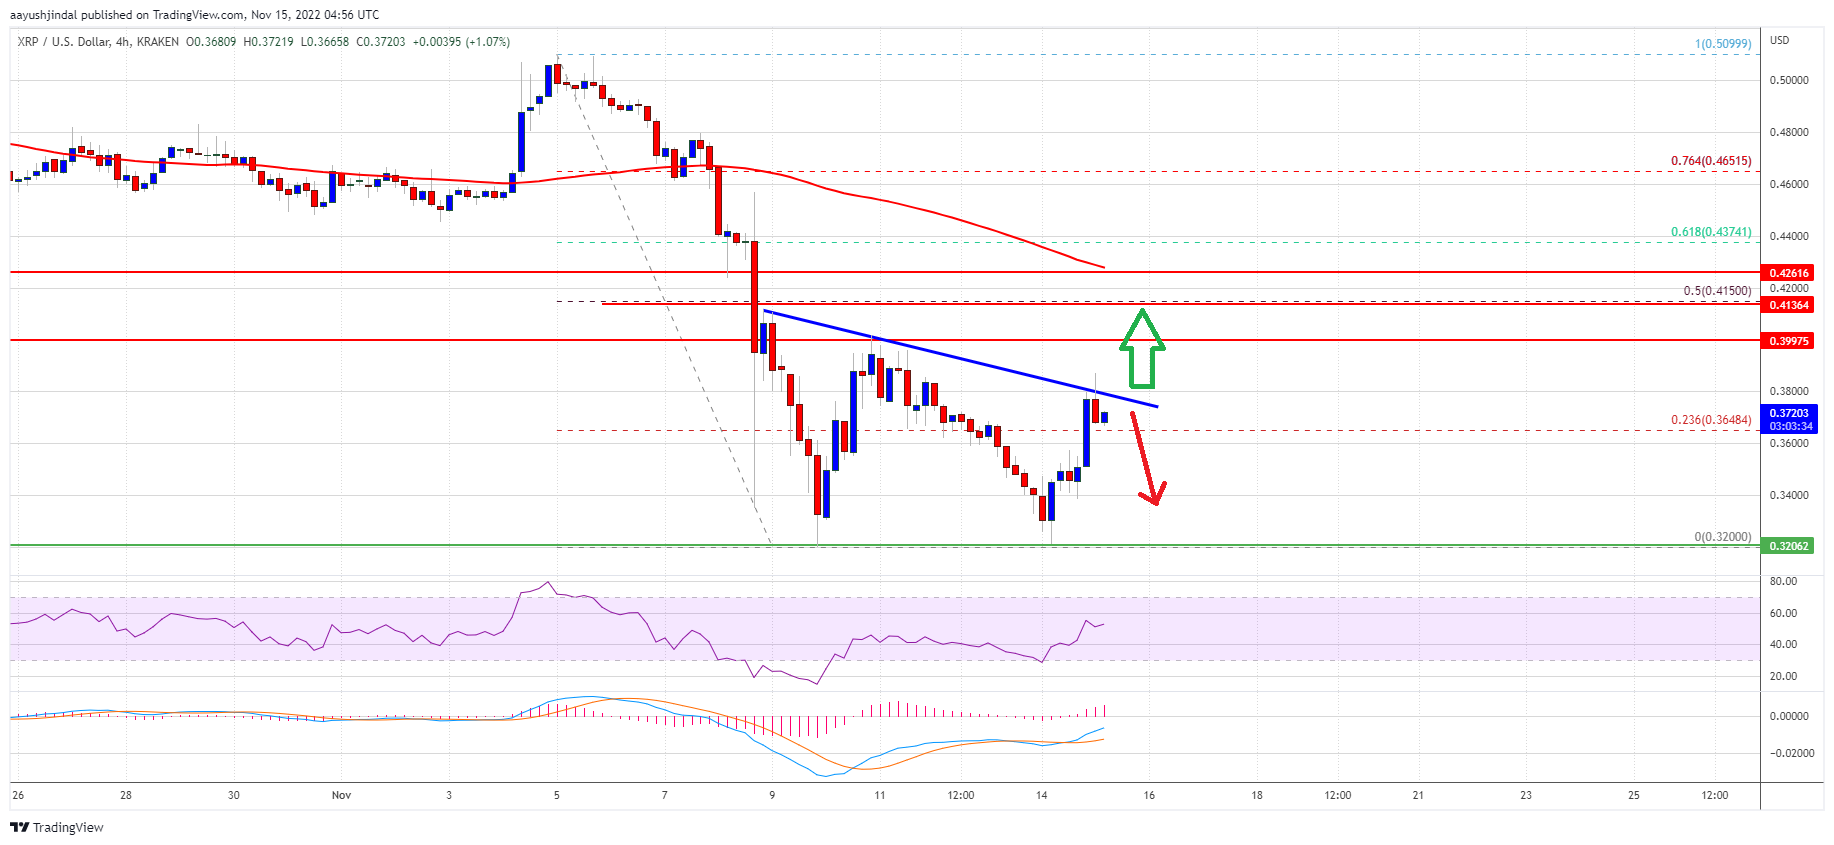
After a sharp decline, ripple’s XRP found support near the $0.4220 zone against the US Dollar. XRP formed a base above the $0.4220 level and started a fresh increase, similar to ethereum and bitcoin.
There was a clear move above the $0.435 and $0.445 resistance levels. The price climbed above the 50% Fib retracement level of the downward move from the $0.5118 swing high to $0.4220 swing low. However, the price struggled to clear the $0.4800 resistance and the 100 simple moving average (4-hours).
It failed to clear the 61.8% Fib retracement level of the downward move from the $0.5118 swing high to $0.4220 swing low. The price is now facing hurdles near $0.460 and the 100 simple moving average (4-hours).
There is also a crucial bearish trend line forming with resistance near $0.4605 on the 4-hours chart of the XRP/USD pair. The main resistance is near the $0.478 and $0.480 levels. A successful break above the $0.478 and $0.480 resistance levels could spark another rally.
Source: XRPUSD on TradingView.com
The next key resistance is near the $0.500 level, above which the bulls are likely to aim a retest of the $0.55 barrier. Any more gains might send the price towards the $0.60 level.
Downside Break in XRP?
If ripple fails to start a fresh increase above the $0.478 level, it could start a fresh decline. An initial support on the downside is near the $0.442 level.
If there is a downside break and close below the $0.442 level, xrp price could start a major decline. In the stated case, the price could even decline below the $0.422 support.
Technical Indicators
4-Hours MACD – The MACD for XRP/USD is now losing pace in the bearish zone.
4-Hours RSI (Relative Strength Index) – The RSI for XRP/USD is now below the 50 level.
Major Support Levels – $0.442, $0.422 and $0.405.
Major Resistance Levels – $0.462, $0.48 and $0.50.