

BNB (Binance coin) price started a fresh rally from the $265 support against the US Dollar. BNB is trading in a positive zone and might soon clear the $350 resistance.
- Binance coin price gained pace above the $300 and $320 resistance levels against the US Dollar.
- The price is now trading well above $300 and the 100 simple moving average (4-hours).
- There are two major bullish trend lines forming with support near $320 and $315 on the 4-hours chart of the BNB/USD pair (data source from Binance).
- The pair could soon resume its rally unless there is a move below the $300 support zone.
Binance Coin Price Remains In Uptrend
After forming a base above the $265 level, BNB price started a strong increase. The bulls took control, resulting in a surge above the $280 and $285 resistance levels.
The price gained pace after it broke the $300 barrier and the 100 simple moving average (4-hours). Finally, it spiked above the $335 level and formed a new monthly high at $337. Recently, there was a minor downside correction below the $330 level, similar to bitcoin and ethereum.
The price tested the 23.6% Fib retracement level of the upward move from the $263 swing low to $337 high. An initial support is near the $320 level. There are also two major bullish trend lines forming with support near $320 and $315 on the 4-hours chart of the BNB/USD pair.
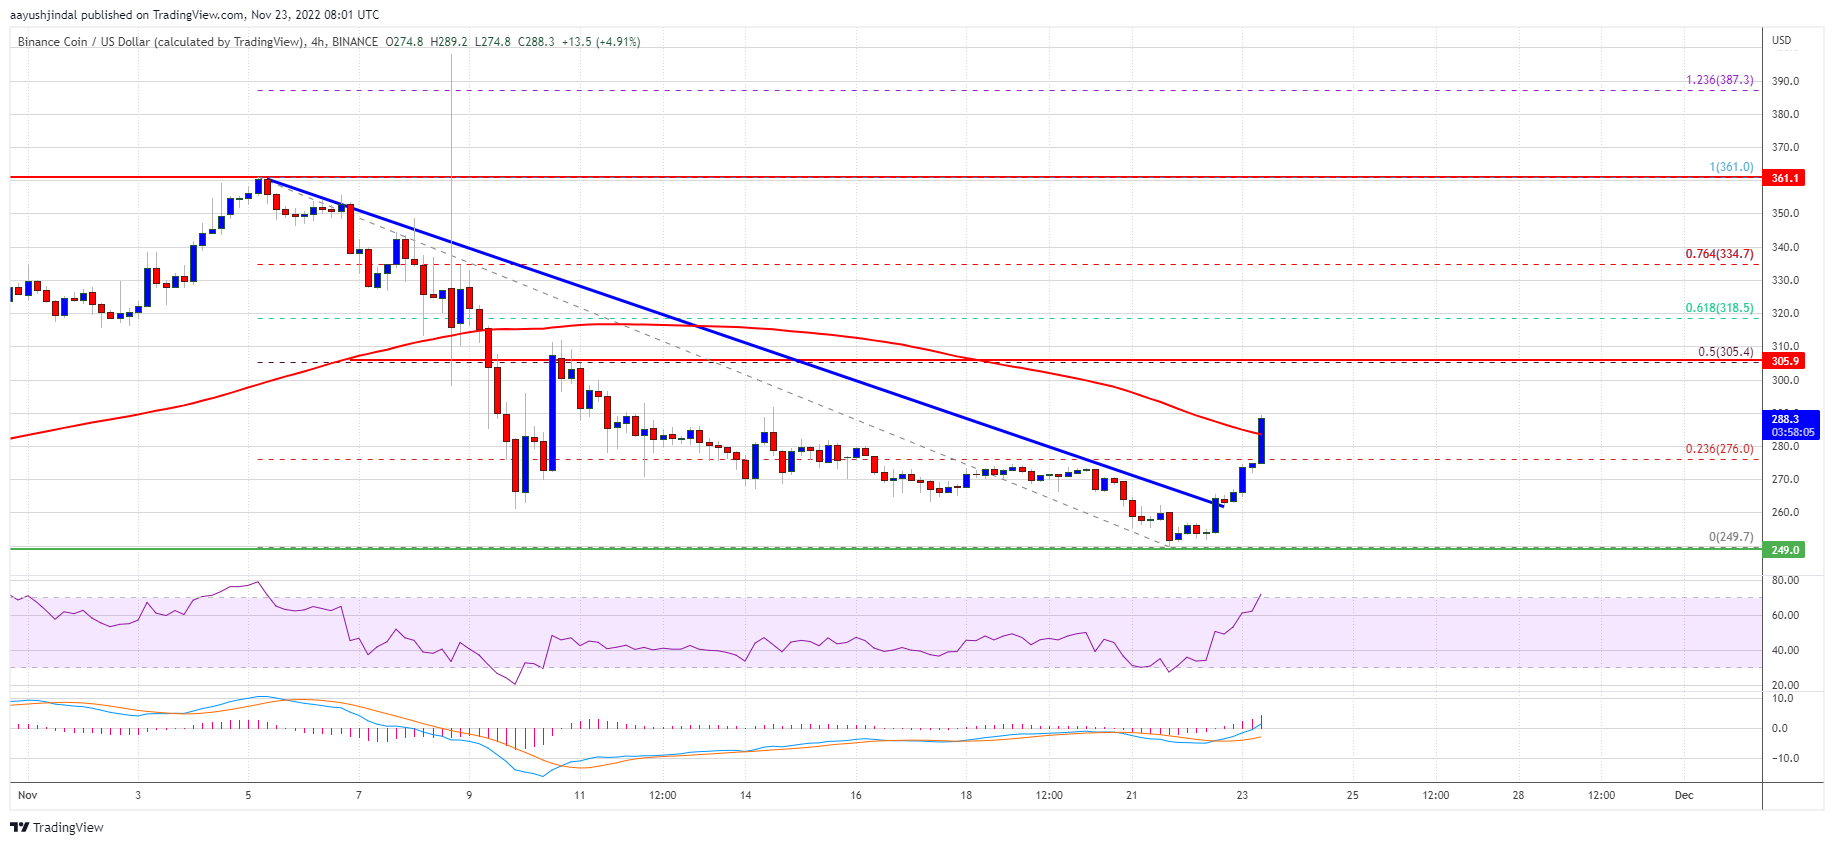
Source: BNBUSD on TradingView.com
The first major support is near the $312 level. The next major support is near the $300 level or the 50% Fib retracement level of the upward move from the $263 swing low to $337 high. If there is a downside break below the $300 support, there could be an extended decline towards the $280 support.
More Upsides in BNB?
If BNB fails remains stable above $320 or $300, it could start a fresh increase. On the upside, the $328 and $330 levels are immediate hurdles.
The next major resistance is near the $335 level, above which the price is likely to aim a test of the $350 level in the near term. Any more gains might send the price towards the $400 level.
Technical Indicators
4-Hours MACD – The MACD for BNB/USD is losing pace in the bullish zone.
4-Hours RSI (Relative Strength Index) – The RSI for BNB/USD is currently well above the 60 level.
Major Support Levels – $320, $312 and $300.
Major Resistance Levels – $330, $335 and $350.