Bitcoin might be returning to the bottom of its current range; trapped for months, BTC might be unable to push higher. Driven by macroeconomic forces and uncertainty, the sideways price action has decreased volatility across global financial assets.
At the time of writing, Bitcoin (BTC) trades at $19,400 with sideways movement across all timeframes. Earlier today, the cryptocurrency hinted at more gains, but bulls have been unable to sustain momentum, surrendering BTC’s profits from last week.
Bitcoin Goes Quiet, Macro Forces Take The Wheel
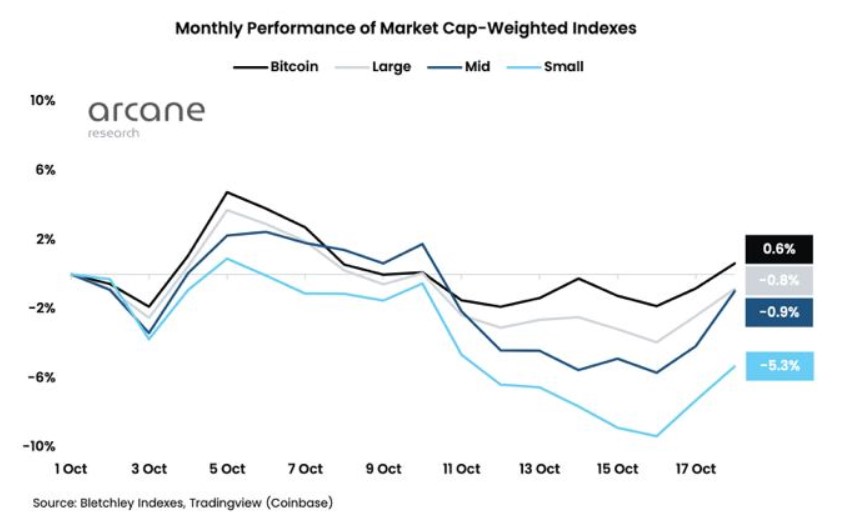
According to Arcane Research, Bitcoin has seen no clear direction in October. The cryptocurrency has been the best-performing asset in terms of assets moving sideways over this period.
The chart below shows that the benchmark cryptocurrency recorded a 0.6% profit over the past 30 days, while other crypto assets trended slightly to the downside. Smaller tokens were the worst performers, with a 5% loss in October.

Smaller cryptocurrencies often suffer the most in a choppy and uncertain market; investors usually take shelter in Bitcoin and stablecoins, measured by the BTC Dominance and the USDT Dominance. These metrics have been trending upward after seeing a massive decline in mid-October.
The spike in stablecoin and BTC dominance hint at more sideways price action as the crypto market enters another stage of uncertainty until the subsequent macroeconomic event triggers an explosion in volatility. Arcane Research noted the following on BTC’s current price action:
Still no clear trend in October, as the crypto market stays flat. Bitcoin and ether are gaining market shares relative to the other large caps this week, while small caps are struggling (…). The crypto market is still highly aligned with the stock market this month. Both Bitcoin and Nasdaq are up 1% in October, with the correlation staying at record highs.
What Happens When BTC Goes Quiet?
Additional data from research firm Santiment indicates that Bitcoin whales might be accumulating BTC at its current levels. The cryptocurrency is moving near its 2017 all-time high. Historically, these levels have provided long-term investors the best opportunity to increase their holdings.
As BTC’s price trends sideways, Bitcoin addresses holding between 10,000 to 100,000 BTC reached their highest level since February 2021. At that time, the cryptocurrency was preparing to re-enter price discovery mode following a major bull run that took it from below $20,000 into the low $30,000.
The research firm noted:
(…) addresses holding 10 to 100 $BTC have reached their highest amount of respective addresses since Feb, 2021. As the number of addresses on a network rise, utility should follow suit.
Despite this data, the current macroeconomic conditions might be unfavorable for a Bitcoin rally leading the cryptocurrency into long periods of accumulation and consolidation around the 2017 ATH and its yearly low of $17,600.

