

Ethereum failed to clear the $1,350 resistance and corrected lower against the US Dollar. ETH is holding the key support and might aim a fresh move to $1,400.
- Ethereum started a downside correction and tested the $1,265 support zone.
- The price is now trading above $1,300 and the 100 hourly simple moving average.
- There is a key bullish trend line forming with support near $1,295 on the hourly chart of ETH/USD (data feed via Kraken).
- The pair seems to be fresh increase above the $1,350 resistance zone.
Ethereum Price Remains Supported
Ethereum struggled to continue higher above the $1,350 resistance, similar to bitcoin price. ETH formed a short-term high at $1,343 and started a downside correction.
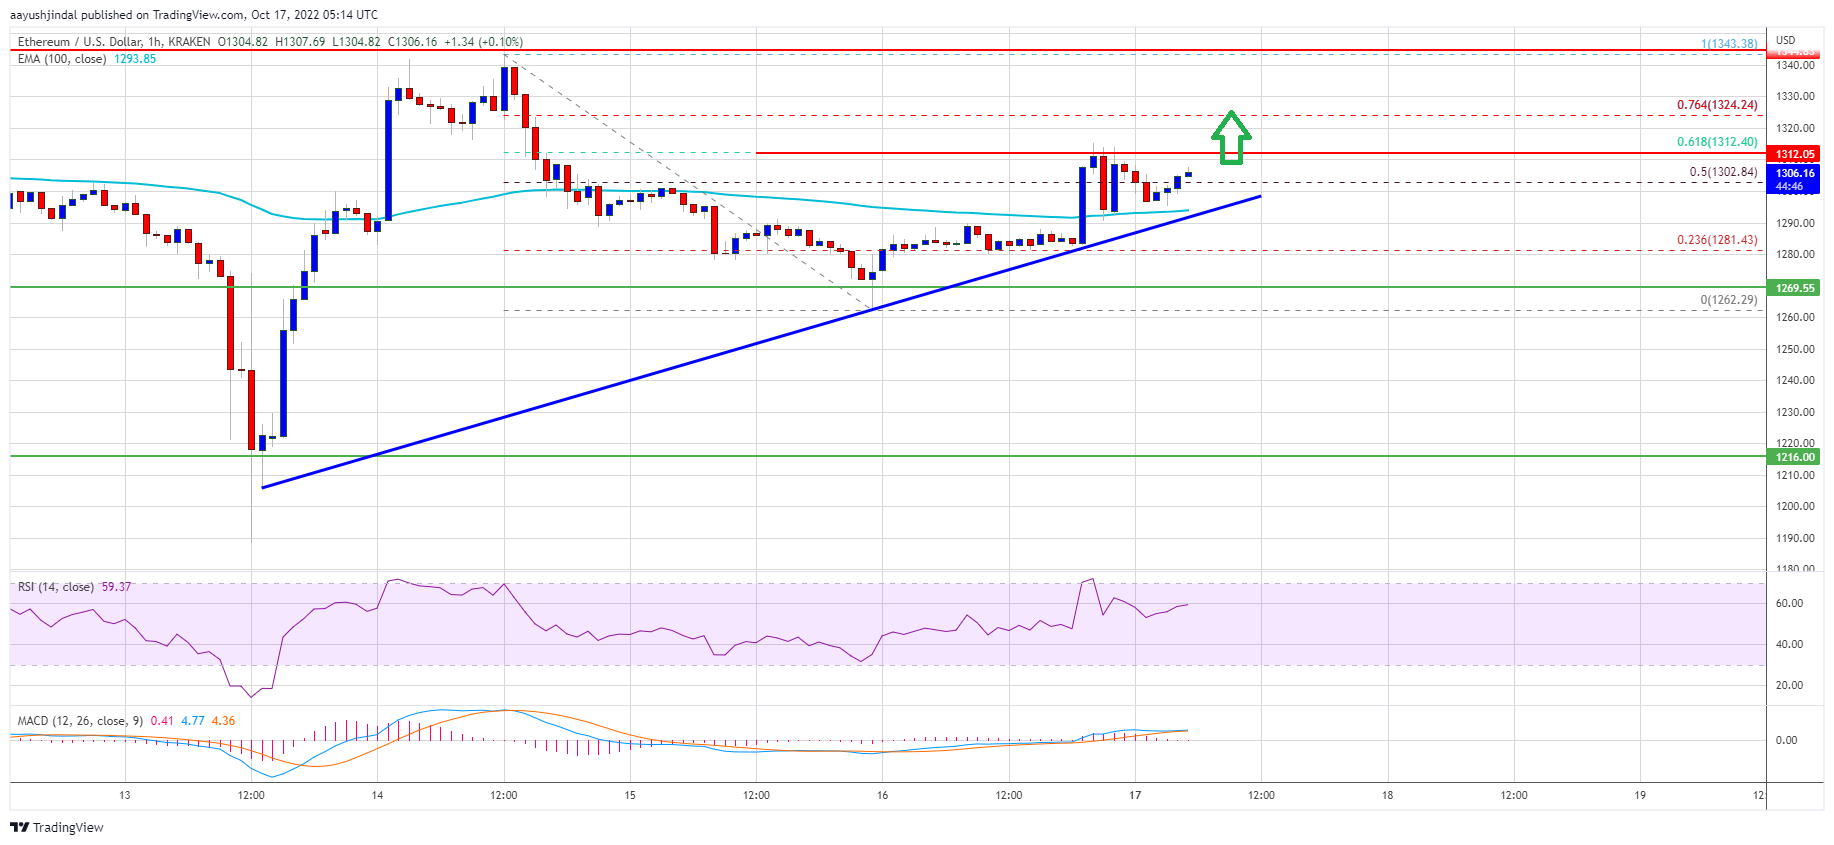
There was a move below the $1,320 and $1,300 levels. Ether price even spiked below $1,280 and the 100 hourly simple moving average. However, the bulls were active near the $1,265 support zone. A low was formed near $1,262 and the price is now rising.
There was a move above the $1,290 and $1,300 levels. The price cleared the 50% Fib retracement level of the recent decline from the $1,343 swing high to $1,262 low.
It is now trading above $1,300 and the 100 hourly simple moving average. There is also a key bullish trend line forming with support near $1,295 on the hourly chart of ETH/USD. An immediate resistance on the upside is near the $1,315 level.
It is near the 61.8% Fib retracement level of the recent decline from the $1,343 swing high to $1,262 low. A clear upside break above the $1,315 resistance zone could open the doors for more gains.
Source: ETHUSD on TradingView.com
In the stated case, the price may perhaps rise towards the $1,350 resistance. Any more gains might send the price towards the $1,400 resistance.
Downside Break in ETH?
If ethereum fails to climb above the $1,315 resistance, it could continue to move down. An initial support on the downside is near the $1,300 level and the 100 hourly simple moving average.
The next major support is near the $1,265 level. A downside break below the $1,265 zone might start a fresh decline to $1,215. Any more losses may perhaps open the gates for a move towards the $1,150 support.
Technical Indicators
Hourly MACD – The MACD for ETH/USD is now gaining momentum in the bullish zone.
Hourly RSI – The RSI for ETH/USD is now above the 50 level.
Major Support Level – $1,265
Major Resistance Level – $1,350