

Ethereum tested the key $1,265 support zone against the US Dollar. ETH might correct higher, but upsides could face hurdles near $1,300 and $1,310.
- Ethereum remains in a bearish zone below the $1,350 and $1,320 support levels.
- The price is now trading below $1,300 and the 100 hourly simple moving average.
- There was a break above a connecting bearish trend line with resistance near $1,285 on the hourly chart of ETH/USD (data feed via Kraken).
- The pair remains at a risk of a sharp decline if it stays below the $1,300 pivot level.
Ethereum Price Faces Hurdles
Ethereum gained bearish pace and settled below the $1,300 support zone. ETH even declined below the $1,280 level and settled below the 100 hourly simple moving average.
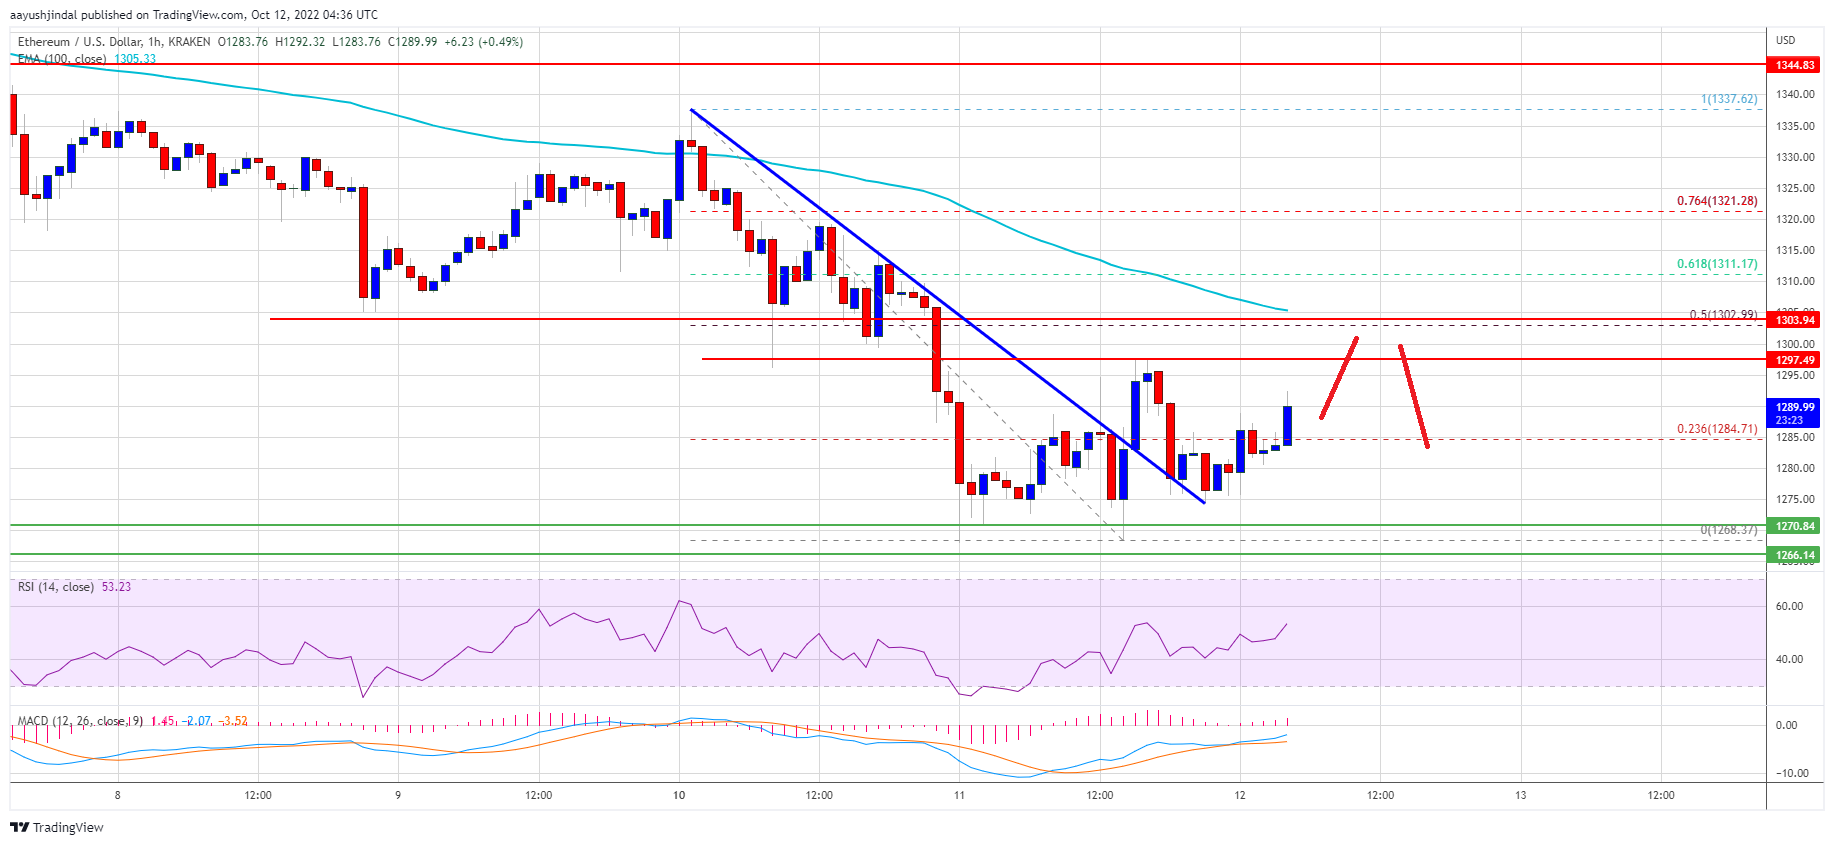
There was a minor push below yesterday’s low, but the bulls were active near the $1,265 zone. A low was formed near $1,268 and the price is now correcting higher. There was a short-term wave above the $1,280 level. Ether price was able to clear the 23.6% Fib retracement level of the recent drop from the $1,337 swing high to $1,268 low.
Besides, there was a break above a connecting bearish trend line with resistance near $1,285 on the hourly chart of ETH/USD. It is now trading below $1,300 and the 100 hourly simple moving average.
An immediate resistance on the upside is near the $1,295 level. The first major resistance is near the $1,300 level. It is close to the 50% Fib retracement level of the recent drop from the $1,337 swing high to $1,268 low. If there is an upside break above the $1,300 resistance zone, ethereum price might rise towards the $1,320 resistance.
Source: ETHUSD on TradingView.com
A clear break above $1,320 could send the price further higher. The next major resistance could be near the $1,350 level, above which the price could revisit $1,400.
More Losses in ETH?
If ethereum fails to recover above the $1,300 resistance, it could continue to move down. An initial support on the downside is near the $1,270 level.
The next major support is near the $1,265 level. A downside break below the $1,265 might spark a sharp decline. In the stated case, ether price may perhaps decline towards the $1,200 level.
Technical Indicators
Hourly MACD – The MACD for ETH/USD is now losing momentum in the bearish zone.
Hourly RSI – The RSI for ETH/USD is now above to the 50 level.
Major Support Level – $1,265
Major Resistance Level – $1,300