

Bitcoin price is slowly moving lower below the $19,200 support against the US Dollar. BTC could slide further if there is further escalation in Russia-Ukraine war situation.
- Bitcoin is slowly moving lower below the $19,200 and $19,000 levels.
- The price is trading below above $19,500 and the 100 hourly simple moving average.
- There is a connecting bearish trend line forming with resistance near $19,260 on the hourly chart of the BTC/USD pair (data feed from Kraken).
- The pair could continue to move down if there is a clear move below the $18,920 support.
Bitcoin Price Slides
Bitcoin price remained in a bearish zone below the $20,000 support zone. BTC slowly moved and settled below the $19,500 support plus the 100 hourly simple moving average.
There was a clear move below the $19,200 support zone, increasing pressure on the bulls. Finally, the price moved below the $19,000 level and traded as low as $18,970. The price is now consolidating losses near the $19,000 pivot level.
Bitcoin price is trading below above $19,500 and the 100 hourly simple moving average. There is also a connecting bearish trend line forming with resistance near $19,260 on the hourly chart of the BTC/USD pair.
On the upside, an immediate resistance is near the $19,110 level. It is near the 23.6% Fib retracement level of the recent decline from the $19,559 swing high to $18,970 low. The next major resistance sits near the $19,260 zone and the trend line.
The trend line is close to the 50% Fib retracement level of the recent decline from the $19,559 swing high to $18,970 low. A clear move above the trend line might send the price towards the $19,500 resistance or the 100 hourly simple moving average.
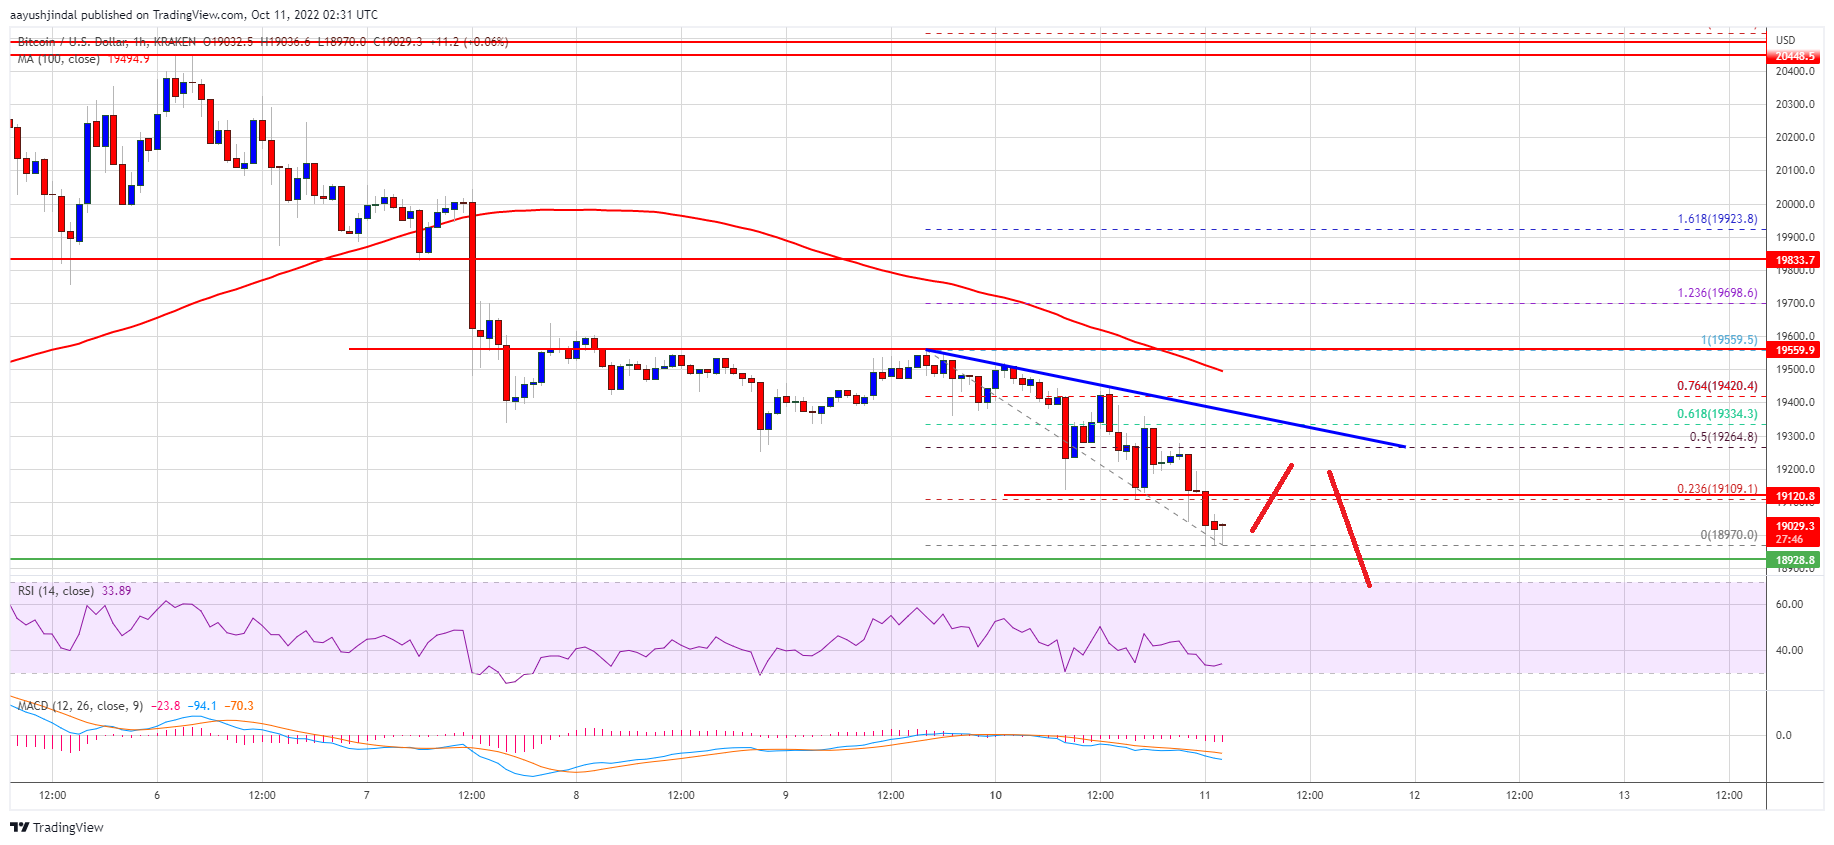
Source: BTCUSD on TradingView.com
Any more gains might send the price above the $19,600 resistance. In the stated case, the price could rise towards the $20,000 resistance level.
More Losses in BTC?
If bitcoin fails to rise above the $19,260 resistance zone, it could continue to move down. An immediate support on the downside is near the $19,000 zone.
The next major support is near the $18,920 zone. A downside break below the $18,920 support zone might call for more losses. In the stated case, there is a risk of a move towards the $18,500 support zone.
Technical indicators:
Hourly MACD – The MACD is now gaining pace in the bearish zone.
Hourly RSI (Relative Strength Index) – The RSI for BTC/USD is now below the 50 level.
Major Support Levels – $19,000, followed by $18,500.
Major Resistance Levels – $19,260, $19,500 and $20,000.