

Bitcoin started another decline from the $19,500 resistance against the US Dollar. BTC is at risk of a sharp decline below the $18,500 and $18,000 levels.
- Bitcoin started another decline after the fed increased rates to 3.25%.
- The price is trading below $19,200 and the 100 hourly simple moving average.
- There was a break below a key bullish trend line with support near $19,000 on the hourly chart of the BTC/USD pair (data feed from Kraken).
- The pair must stay above the $18,200 level to avoid more losses in the near term.
Bitcoin Price Restarts Decline
Bitcoin price attempted to gain strength above the $19,200 level. However, BTC failed to clear the $19,500 resistance zone and stayed in a bearish zone.
As a result, there was a bearish reaction below the $19,000 level. The fed rate hike from 2.75% to 3.25% triggered a sharp decline. There was a break below a key bullish trend line with support near $19,000 on the hourly chart of the BTC/USD pair.
Bitcoin price is now trading below $19,200 and the 100 hourly simple moving average. There was a retest of the $18,200 zone and the price traded as low as $18,140. It is now consolidating losses above the $18,200 support zone.
There was a move above the 23.6% Fib retracement level of the recent decline from the $19,675 swing high to $18,140 low. On the upside, an immediate resistance is near the $18,775 level. The next major resistance sits near the $19,000 level.
The 50% Fib retracement level of the recent decline from the $19,675 swing high to $18,140 low is also near the $19,000 zone. The main resistance is now forming near the $19,200 zone and the 100 hourly simple moving average.
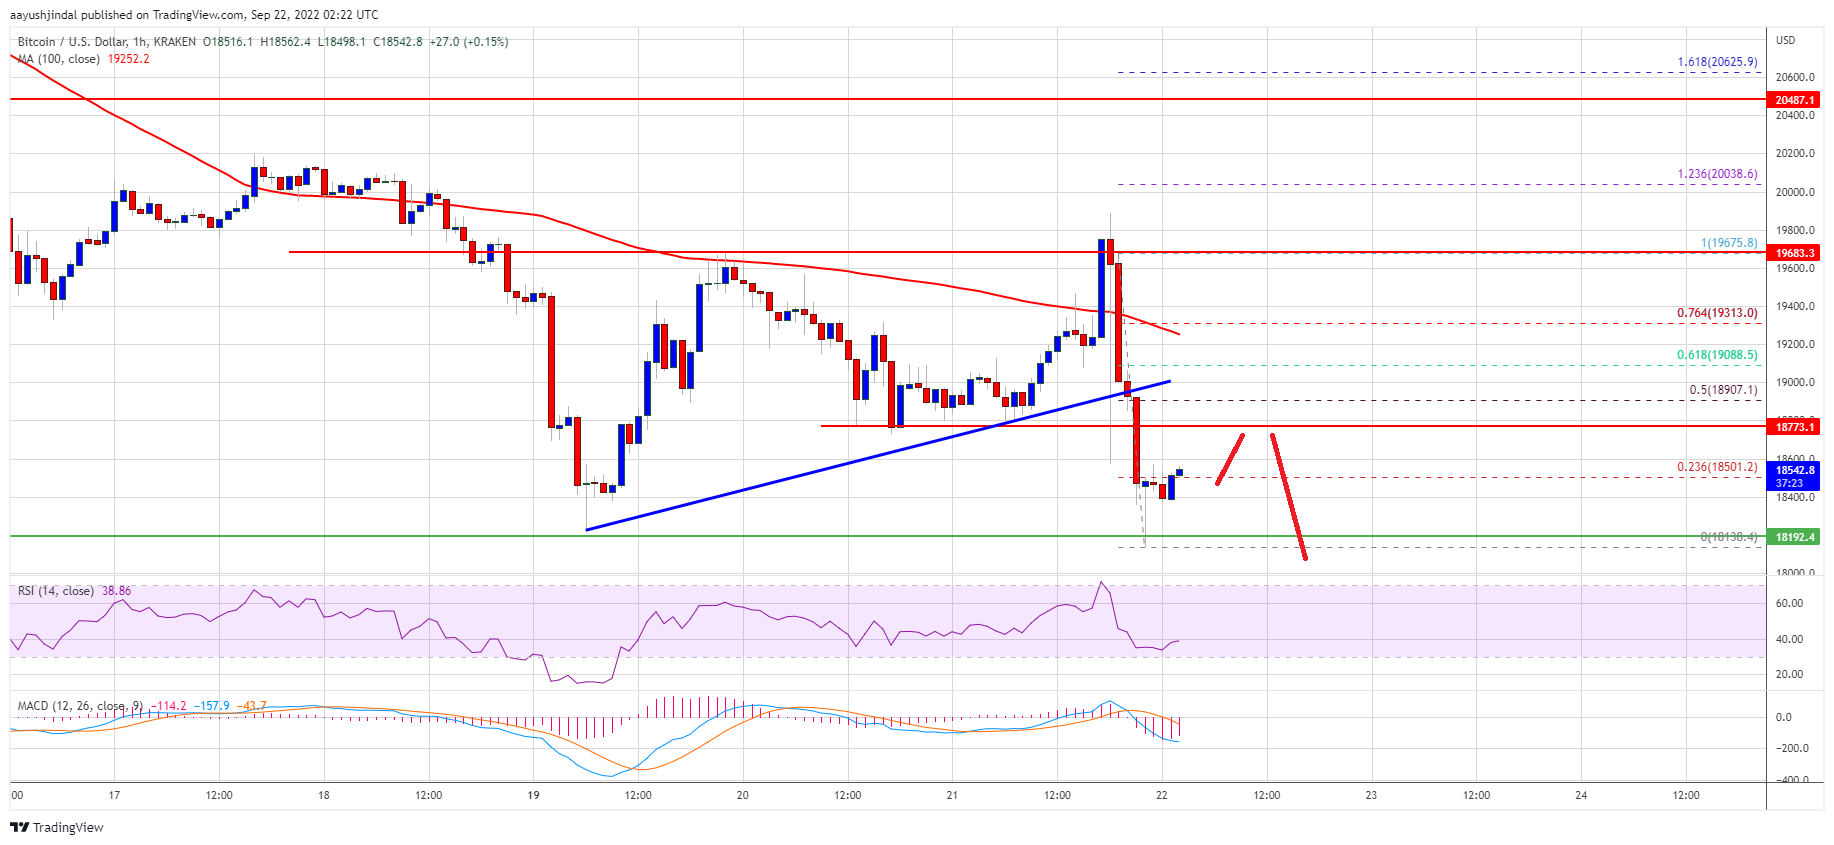
Source: BTCUSD on TradingView.com
A close above the $19,200 level might increase the chances of a move to $19,650. Any more gains might send the price towards the $20,000 resistance zone.
More Losses in BTC?
If bitcoin fails to recover above the $19,000 zone, it could continue to move down. An immediate support on the downside is near the $18,200 zone.
The next major support is near the $18,000 level. A clear move below the $18,000 zone could set the pace for a larger decline. In the stated case, the price may even test the $17,000 level.
Technical indicators:
Hourly MACD – The MACD is now losing pace in the bearish zone.
Hourly RSI (Relative Strength Index) – The RSI for BTC/USD is now below the 50 level.
Major Support Levels – $18,200, followed by $18,000.
Major Resistance Levels – $19,000, $19,200 and $19,500.