

Ethereum declined sharply from the $1,500 resistance zone against the US Dollar. ETH is down over 10% and there could be more losses towards the $1,200 support.
- Ethereum started a fresh decline after it failed to clear the $1,500 resistance zone.
- The price is now trading below $1,400 and the 100 hourly simple moving average.
- There is a key bearish trend line forming with resistance near $1,360 on the hourly chart of ETH/USD (data feed via Kraken).
- The pair could accelerate further lower below the $1,300 support zone in the near term.
Ethereum Price Starts Fresh Drop
Ethereum failed to gain strength for a move above the $1,480 and $1,500 resistance levels. ETH formed a top near the $1,475 level and started a fresh decline.
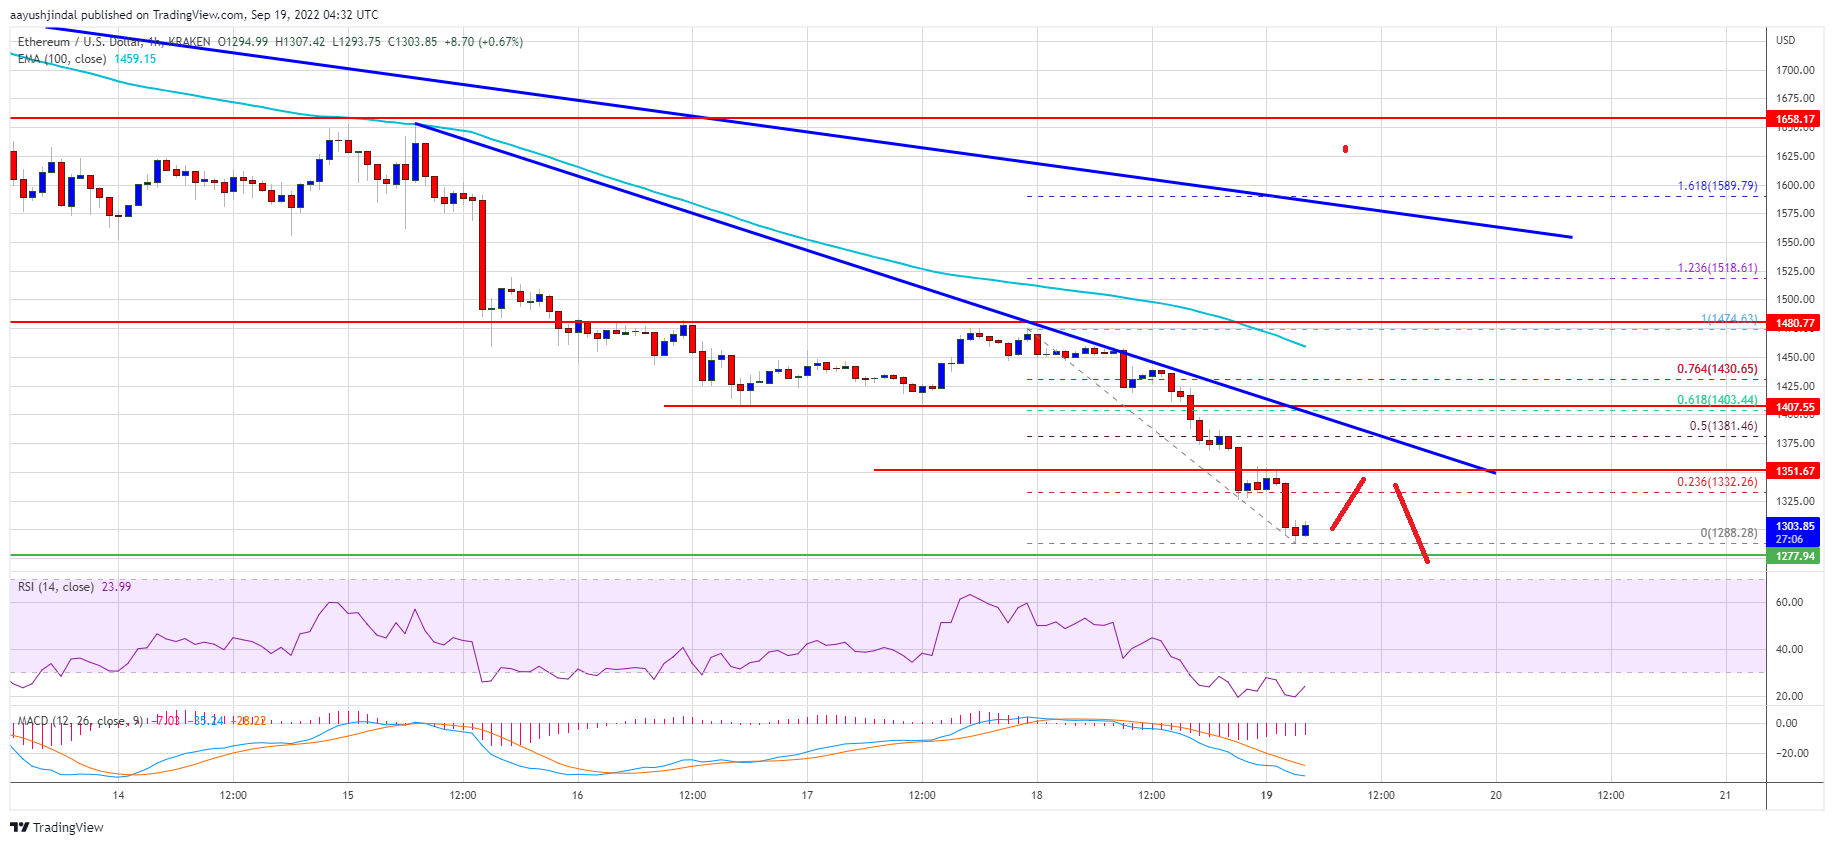
There was a steady decline below the $1,400 level and the 100 hourly simple moving average. The price even traded below the $1,350 and $1,320 support levels. There was a drop over around 10% and the price traded as low as $1,288.
Ether price is now consolidating losses above the $1,280 level and below the 100 hourly simple moving average. On the upside, the price is facing resistance near the $1,335 level. It is near the 23.6% Fib retracement level of the recent decline from the $1,474 swing high to $1,288 low.
The next major resistance is near the $1,360 and $1,380 levels. There is also a key bearish trend line forming with resistance near $1,360 on the hourly chart of ETH/USD. It is near the 50% Fib retracement level of the recent decline from the $1,474 swing high to $1,288 low.
Source: ETHUSD on TradingView.com
A clear break above $1,380 might send the price towards the $1,440 level. Any more gains may perhaps open the doors for a move towards the $1,480 resistance in the near term.
More Losses in ETH?
If ethereum fails to rise above the $1,360 resistance, it could continue to move down. An initial support on the downside is near the $1,300 zone.
The next major support is near $1,260. A downside break below the $1,260 support might another sharp decline. In the stated case, ether price might decline towards the $1,200 level.
Technical Indicators
Hourly MACD – The MACD for ETH/USD is now gaining momentum in the bearish zone.
Hourly RSI – The RSI for ETH/USD is now below the 50 level.
Major Support Level – $1,300
Major Resistance Level – $1,360