

Bitcoin price is struggling to climb higher above $19,200 against the US Dollar. BTC could start a major decline if it breaks the $18,900 and $18,500 support levels.
- Bitcoin failed to gain pace and remained in a bearish zone below $19,500.
- The price is trading below $19,400 and the 100 hourly simple moving average.
- There is a short-term breakout pattern forming with resistance near $19,200 on the hourly chart of the BTC/USD pair (data feed from Kraken).
- The pair could start a steady recovery if there is a clear move above $19,200 and then $19,500.
Bitcoin Price Continues To Struggle
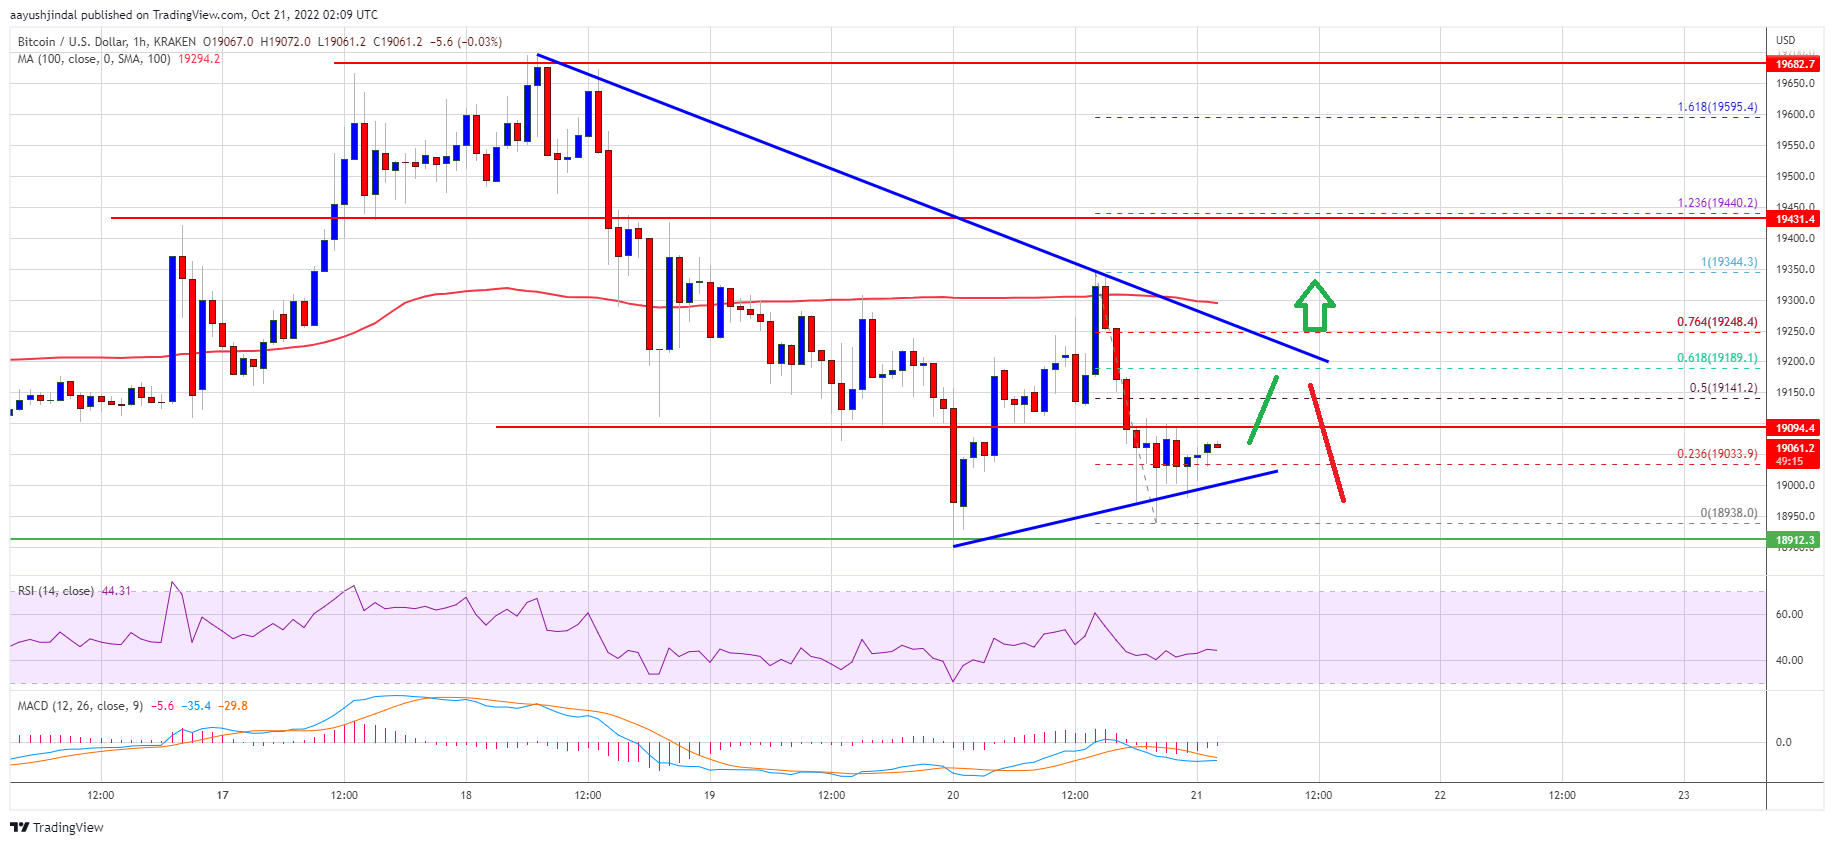
Bitcoin price attempted a move towards the $19,500 resistance zone. BTC remained in a bearish zone and even failed to clear the $19,400 level. A high was formed near $19,344 and there was a fresh decline.
The price declined below the $19,200 level and tested $18,950. A low is formed near $18,938 and the price is now consolidating losses. It traded above the 23.6% Fib retracement level of the recent drop from the $19,344 swing high to $18,938 low.
Bitcoin price is now trading below $19,400 and the 100 hourly simple moving average. There is also a short-term breakout pattern forming with resistance near $19,200 on the hourly chart of the BTC/USD pair.
On the upside, an immediate resistance is near the $19,150 level. It is close to the 50% Fib retracement level of the recent drop from the $19,344 swing high to $18,938 low. The first major resistance sits near the $19,200 level and the trend line.
Source: BTCUSD on TradingView.com
The next major resistance might be $19,300 or the 100 hourly SMA. A clear move above the $19,300 resistance might send the price towards the $19,500 resistance. Any more gains might open the doors for a move towards the $20,000 resistance zone.
Downside Break in BTC?
If bitcoin fails to rise above the $19,200 resistance zone, it could continue to move down. An immediate support on the downside is near the $19,000 zone.
The next major support is near the $18,900 zone. A downside break and close below might call for a test of the main breakdown support at $18,500. Any more losses might start a major decline and the price could drop to $17,500.
Technical indicators:
Hourly MACD – The MACD is now losing pace in the bearish zone.
Hourly RSI (Relative Strength Index) – The RSI for BTC/USD is now below the 50 level.
Major Support Levels – $19,000, followed by $18,900.
Major Resistance Levels – $19,200, $19,300 and $19,500.